12 NCA in practice
12.1 Summary of this chapter
This chapter may be of interest to practitioners and scholars who are engaged in the practical application of NCA. First, in Section 12.2, the value of NCA for practice is explained by distinguishing between must-have factors for desired outcomes (e.g., performance), and stop factors for undesired outcomes (e.g., risks, disorders) on which practitioners can act through intervention. It discusses the added value and challenges of shifting attention from the common average effect thinking to necessity thinking. This section also mentions application areas by referring to academic work that suggests such an application. The next section (Section 12.3) discusses NCA’s contribution to change and innovation in more detail. In an NCA-based intervention, levels of actionable factors are changed to make a specific practical outcome possible. This starts with the formulation of an intervention strategy, in which goals, barriers/drivers, and target groups are specified, culminating in necessity hypotheses. After that, the intervention is designed, based on collected data that are analyzed using NCA. The next two sections (Sections 12.4 and 12.5) discuss how interventions can make a desired outcome possible, and can prevent undesired outcomes, respectively. Concepts like intervention effectiveness, efficiency and waste are introduced. Section 12.6 discusses interventions with multiple necessary conditions. In the final section (Section 12.7), the application of an NCA-based intervention is illustrated with an example.
12.2 The practical value of necessity logic
Practice refers to the real-world context in which practitioners operate and implement interventions. For example:
Teachers, school leaders, and others create effective learning environments in education.
Employees, managers, and entrepreneurs create, produce, and deliver products and services in business and civil services.
Physicians, nurses, and related professionals diagnose and treat health problems in health care.
Ecologists, policymakers, and consumers prevent environmental degradation through collaborative actions in environmental management.
In any domain, interventions can benefit from knowledge about necessary conditions. By acting on these conditions, interventions can either make a desired outcome possible (e.g., student learning, business success) or make an undesired outcome impossible (e.g., disease, environmental harm). Ignoring necessary conditions can make interventions ineffective or inefficient.
Applying necessity logic often tells a previously undiscovered story for many practitioners. NCA offers a straightforward and practical way to analyze complex problems that may initially seem “too simple to be true.” It identifies must-have factors that are non-compensable requirements for a desired outcome, and stop factors that can block an undesired outcome. Achieving a desired outcome requires all must-have factors to be present, while the absence of a single factor guarantees failure. Preventing an undesired outcome is possible by removing just a single stop factor.
Figure 12.1-left shows what happens if necessity applies.
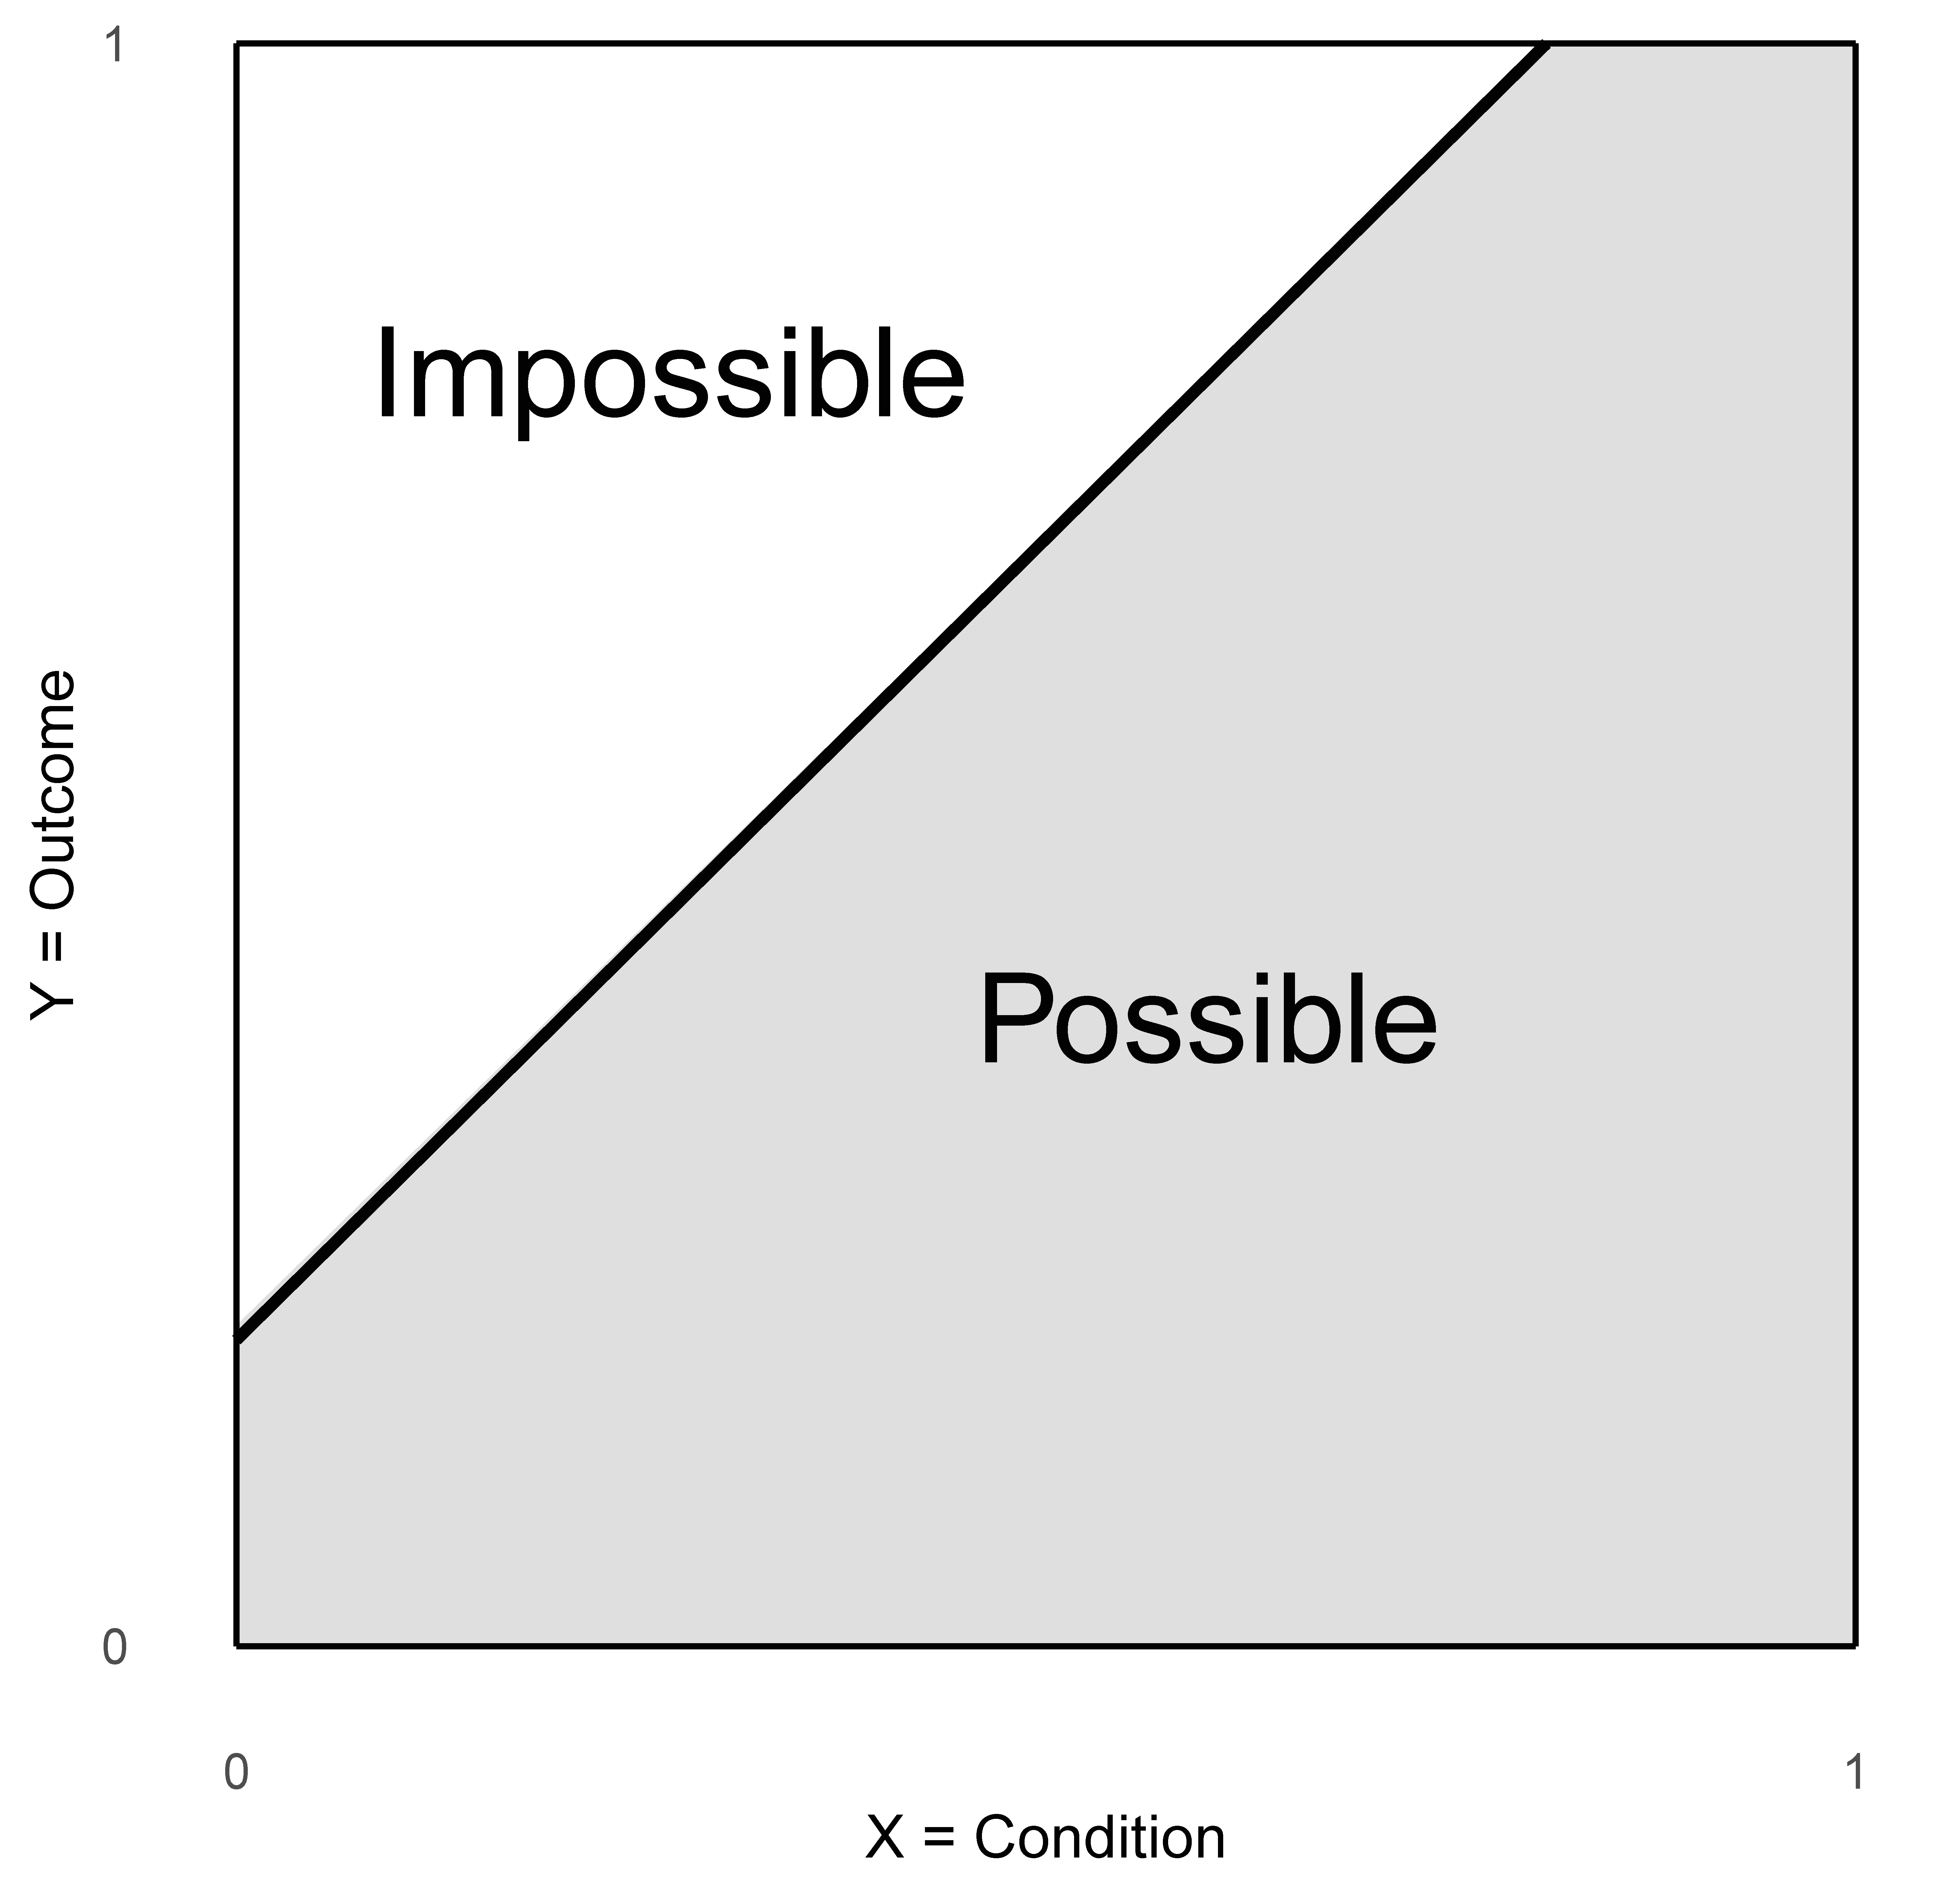
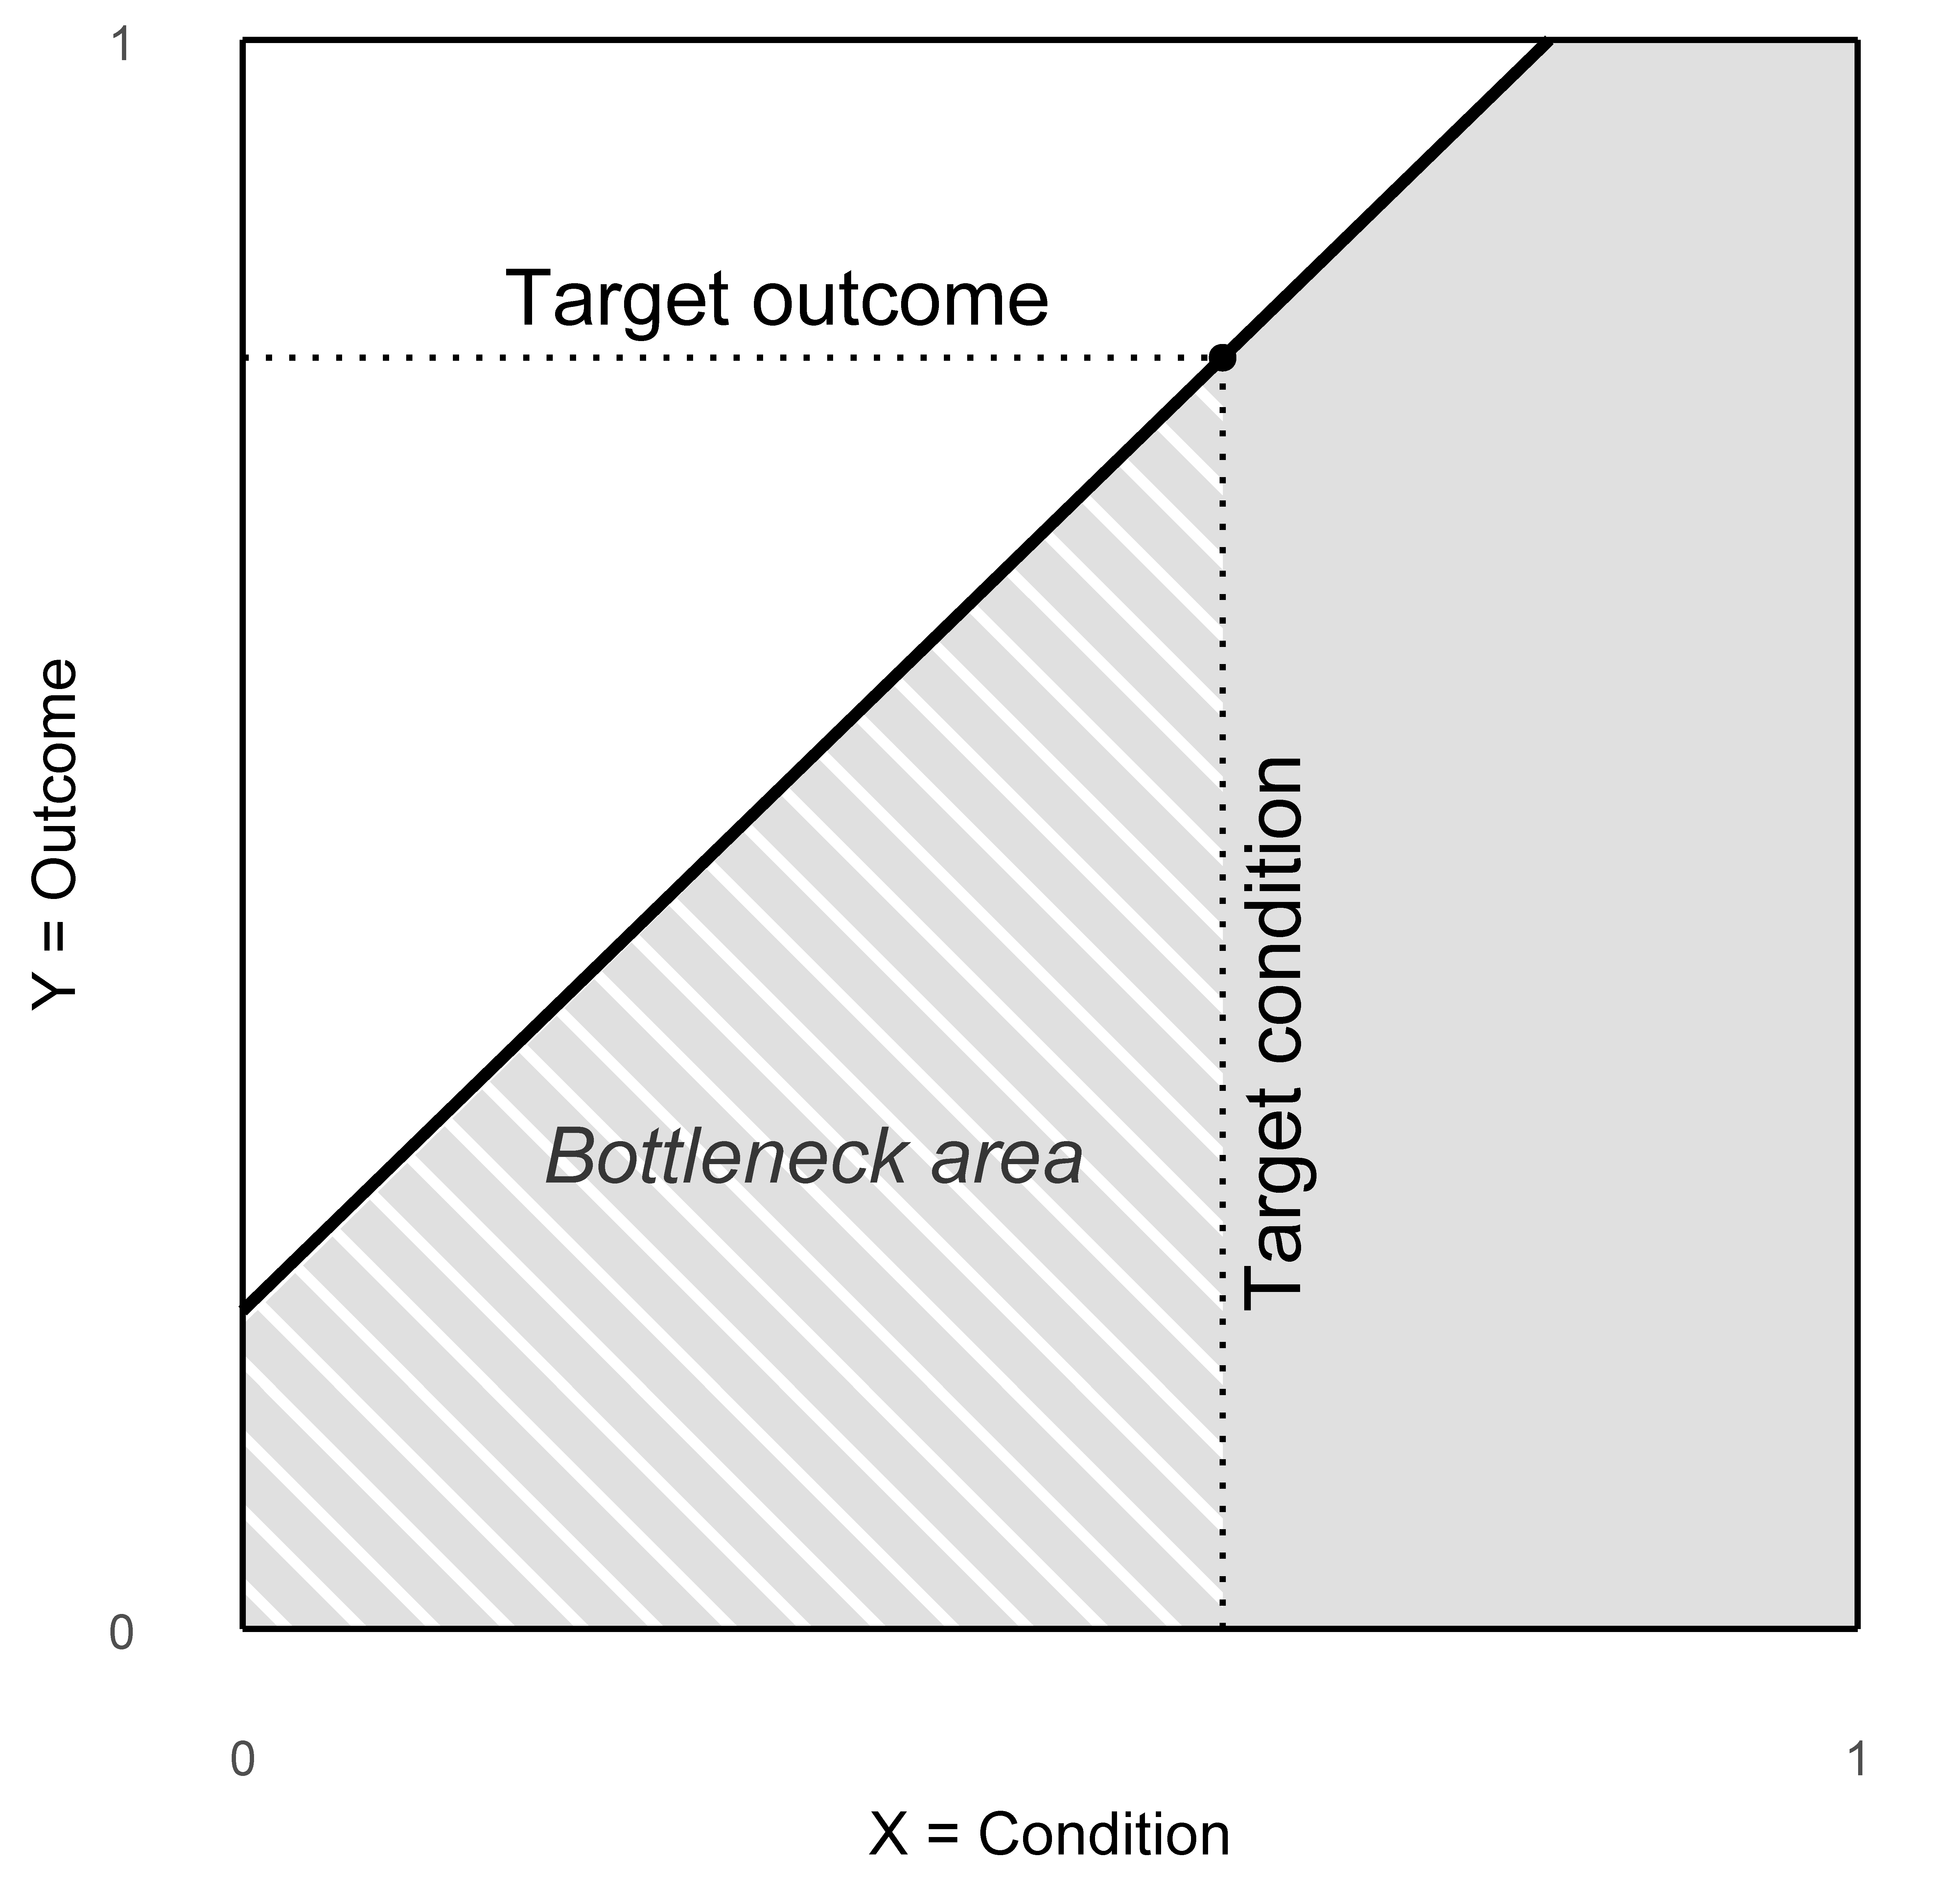
Figure 12.1: \(XY\)-plot with the ceiling line dividing the area where cases are impossible from the area where cases are possible (Left). The target condition is the threshold level of \(X\) that is necessary for the target outcome: a desired or undesired level of \(Y\). Cases that stay in the bottleneck area cannot reach the target outcome (Right).
12.2.1 Must-have factors for desired outcomes
Necessary conditions for a desired outcome (e.g., performance) are must-have factors: without them, the desired level of the outcome cannot be reached. In the \(XY\)-plot in Figure 12.1-left, the ceiling marks a boundary that cases cannot cross. A certain desired target level of the outcome (Figure 12.1-right) is only possible if the condition value is at or above the target condition level. The target condition level acts as a binding constraint for the target outcome. It does not determine the outcome by itself, but it sets a minimum requirement that must be satisfied before the target becomes attainable. For a case to have any chance of attaining the target outcome, it must fall within the feasible area on the right side of the target condition.
Cases with condition values below the target condition are bottleneck cases. They lie in the bottleneck area, which is the region with \(X\)-values below the threshold needed for the target outcome. No matter how strongly other contributing conditions are improved, these cases cannot reach the desired outcome level as long as their condition level remains too low.
An intervention can therefore create opportunity by removing this constraint. Increasing the condition level to at least the threshold moves a case out of the bottleneck area and into the non-bottleneck area to the right of it. Therefore, \(X\) functions as a must-have factor for \(Y\): it is the entry ticket to the set of cases for which the target is achievable. From this perspective, the goal of an intervention is to raise \(X\) for bottleneck cases so that they meet or exceed the threshold and can, in principle, attain the desired outcome.
12.2.2 Stop factors for undesired outcomes
Necessary conditions also matter when the target outcome is undesirable (e.g., risk, disease). In that setting, the same threshold logic flips interpretation: rather than asking what is required to enable a good outcome, the question is what is required for a bad outcome to be possible. A condition that is necessary for an undesired outcome becomes a stop factor: keeping it below its threshold blocks the undesired outcome from occurring.
In the \(XY\)-plot, cases in the bottleneck area (with \(X\) below the threshold condition level) cannot reach the undesired target level. In that sense, they are protected: the necessary condition is missing or not high enough, so the harmful outcome is not attainable. By contrast, cases with \(X\) at or above the threshold lie in the feasible region for the undesired outcome; they are the cases “at risk”, because the necessary condition is present and the bad outcome is, at least in principle, possible.
Intervening in this context therefore has a different aim. Instead of lifting cases over a threshold, the goal is to move at-risk cases below it. Reducing \(X\) to a value under the threshold removes the necessary condition for the undesired outcome, closing off the possibility of reaching that harmful target. Thus, when the outcome is undesirable, effective prevention focuses on maintaining the condition level below its critical threshold: if the stop factor is kept low enough, the undesired outcome is blocked by necessity. In other words, a single condition can block an undesired outcome if the value of that condition is below the threshold.
12.2.3 Shifting attention from average to individual interventions
NCA’s necessity logic is inherently threshold-based. It shifts attention away from interventions based on average effects for a group of cases (Figure 12.2) to interventions based on constraints for individual cases.
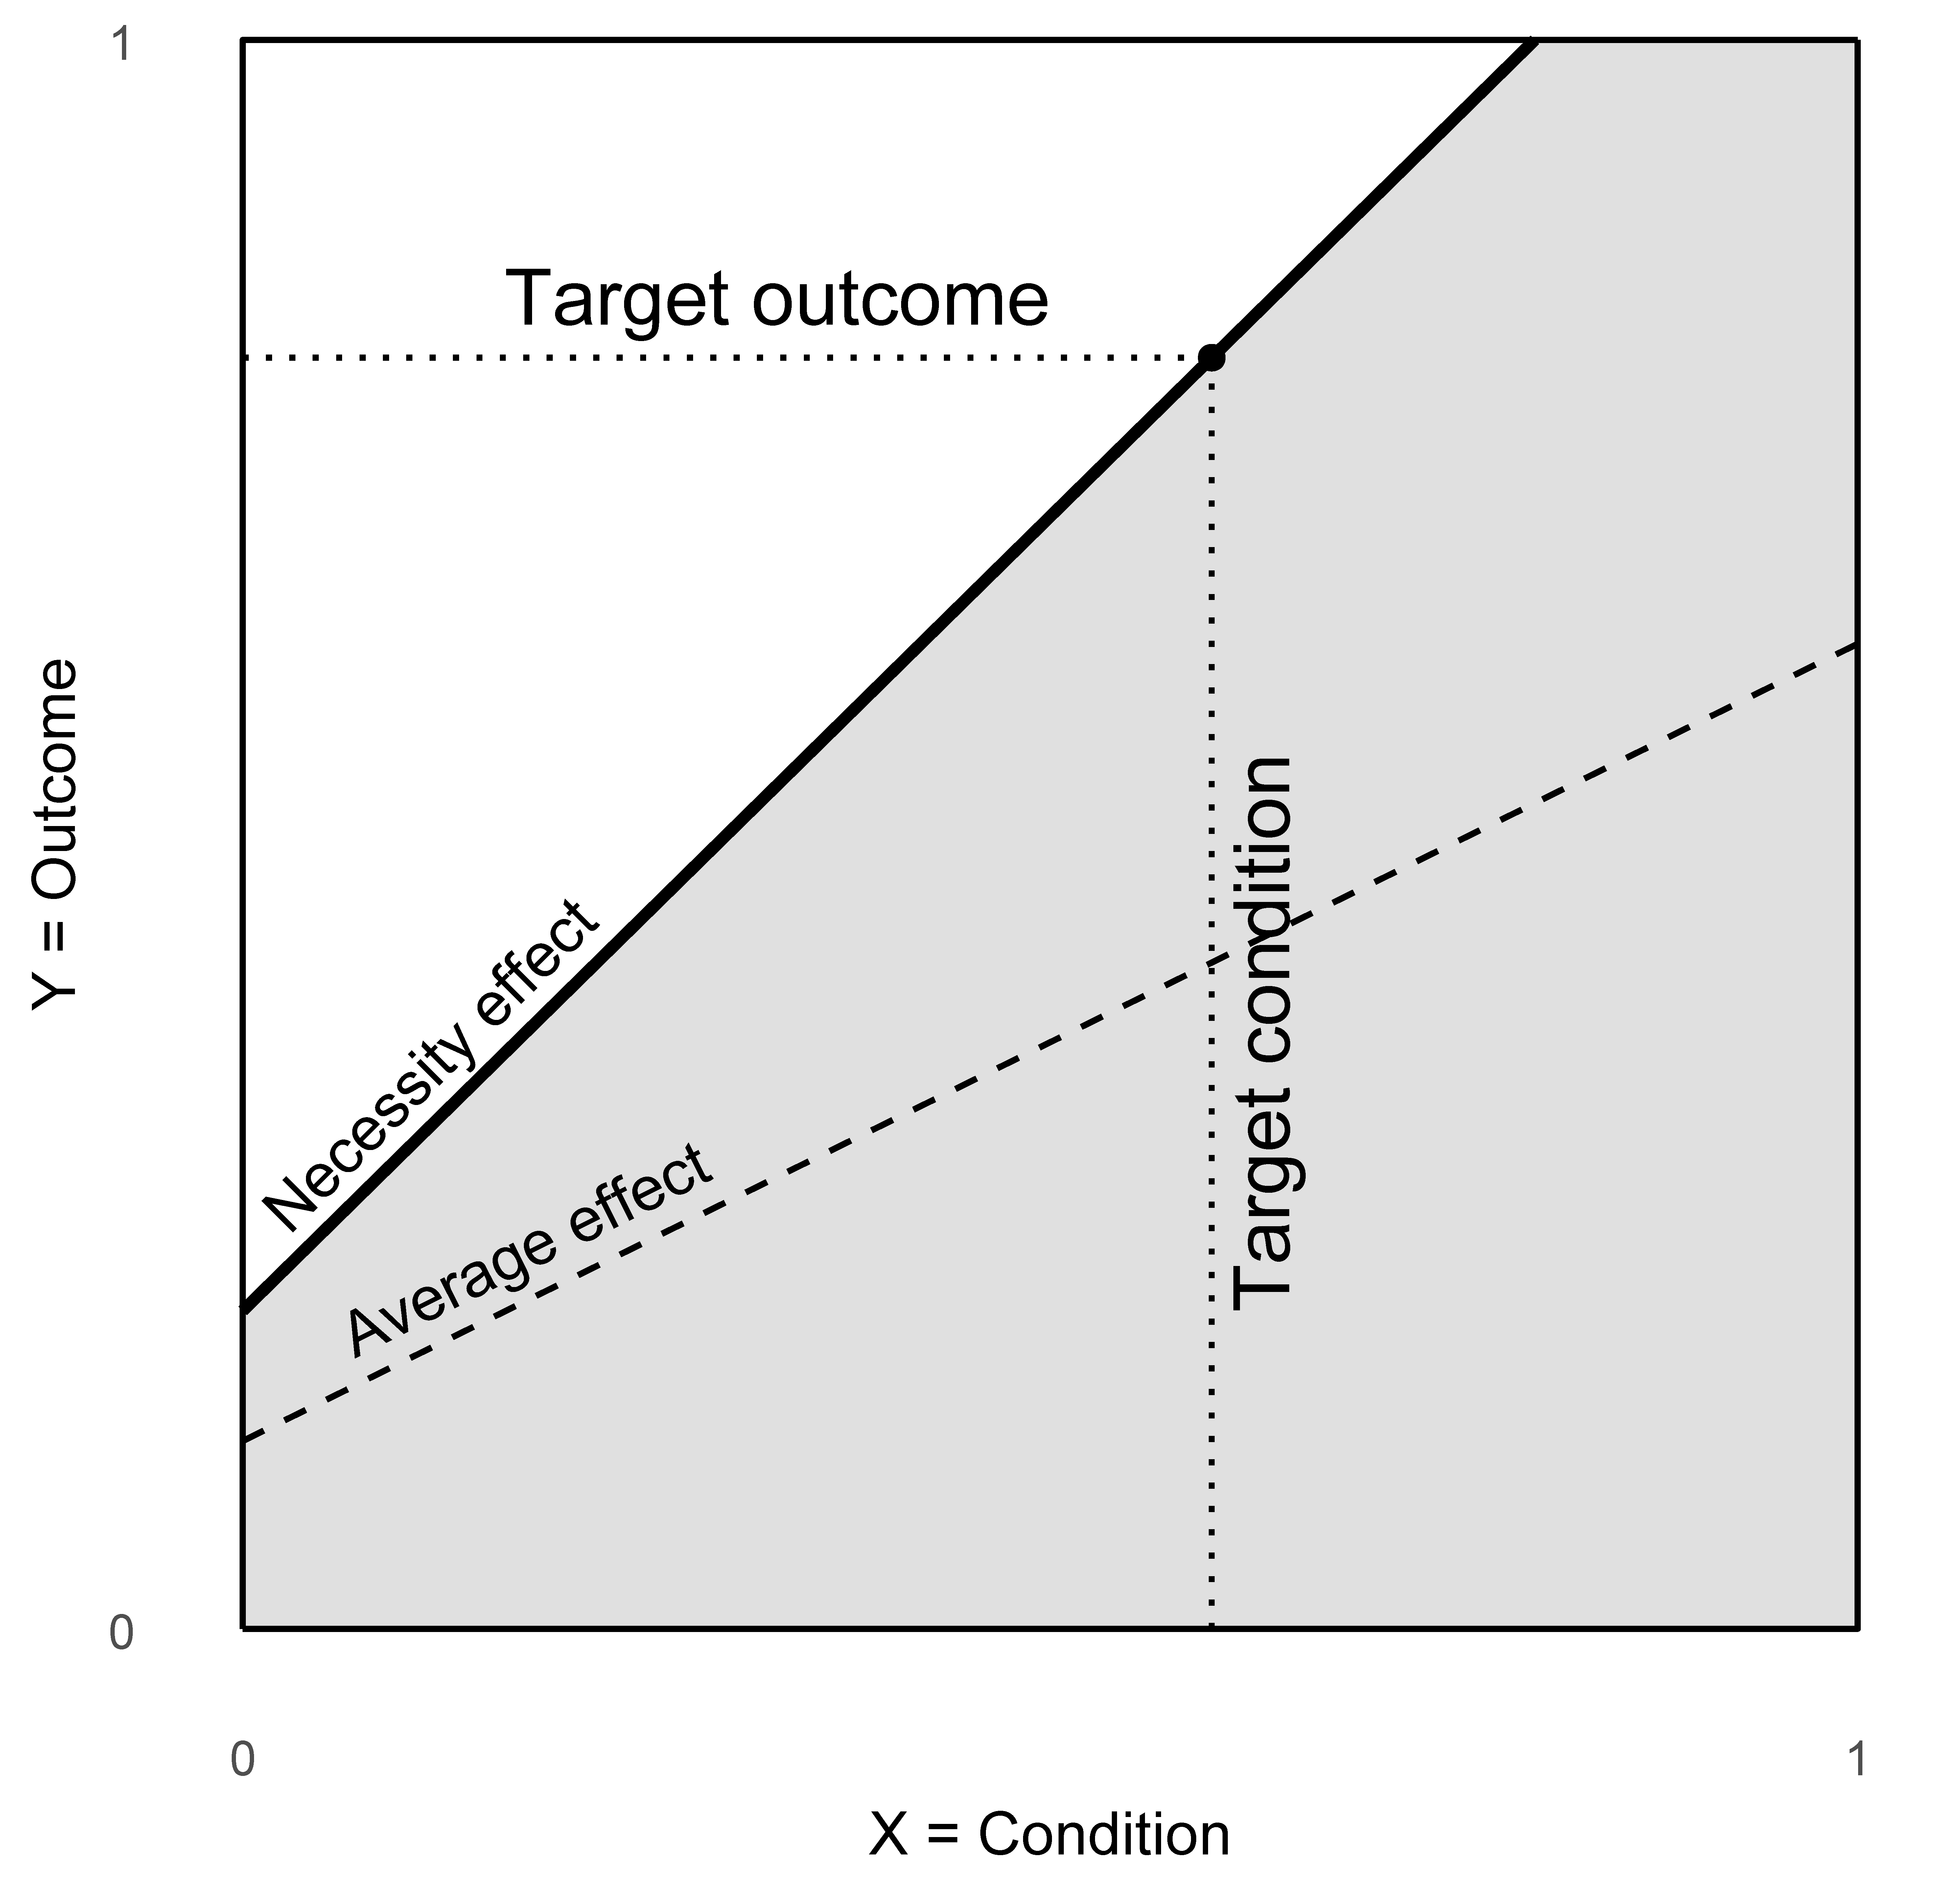
Figure 12.2: Shifting intervention perspective from average effect logic to necessity logic.
Regression-based approaches estimate how much a factor contributes on average to an outcome (nearly always assuming compensatory effects among predictors). Under an average-effect intervention logic, to achieve a desired outcome, the goal generally is to increase contributing factors as much as possible, and for an undesired outcome, the goal generally is to decrease them. In contrast, necessity logic identifies which factors are indispensable: those that must be present for a desired or undesired outcome to be possible at all. Necessity-based intervention logic focuses on ensuring that a condition reaches at least the target condition \(X\) (for a desired outcome) or remains below it (for an undesired outcome), which applies to every single case. NCA’s necessity logic provides such a framework for designing interventions that are effective, efficient, and targeted. It can focus on the relevant cases where the intervention will work: cases that must exit or enter the bottleneck area. This approach complements, and in some situations challenges, the dominant average-effect paradigm that underpins most evidence-based practices (e.g., Dul, 2025). In this way, NCA does not replace but rather enriches causal reasoning in evidence-based practice: it highlights what must (not) exist rather than what merely increases (decreases) an outcome on average.
However, just as it can be difficult to shift the perception from the first woman that is noticed in the picture in Figure 2.5 to the second woman hidden in it, shifting from an average-effect mindset to a necessity-logic mindset is equally challenging (and maybe even more!). Research in the psychology of causality (e.g., Mandel & Lehman, 1998) shows that people naturally overestimate sufficiency (“this condition produces the outcome”) and underestimate necessity (“this condition must be present, otherwise the effect cannot occur”). Sufficiency-based causal reasoning is also dominant in learning and working environments. Statistical education is dominated by probabilistic sufficiency models, and many scientific methods are designed to detect average effects. As a result, large parts of society operate on the assumption that optimizing averages for the whole group or for subgroups is the only way to understand and improve systems.
The dominance of average-effect logic is visible, for example, in governmental policies that allocate support based on mean income of (sub) groups, in medical protocols built around average treatment effects from clinical trials, and in organizational performance programs aimed at improving average satisfaction scores. Because actions based on overall averages often fail to address the needs of individual cases, systems frequently try to compensate by creating increasingly fine-grained subgroups and then acting on the average within each subgroup. This approach adds complexity without solving the underlying problem: decisions remain driven by averages, not by the specific conditions that determine what is possible for each individual case.
Recognizing necessity logic requires a deliberate shift from asking “What may help?” to asking “What is indispensable?” This change in perspective is subtle but difficult when the standard is average-effect thinking. With a necessity perspective, it becomes possible to act on the specific cases that require attention, rather than designing interventions for broad groups based on averages.
12.2.4 Examples of application areas
Scholars have applied NCA in areas that are relevant for practice. Their studies show that necessity exists and provides relevant information beyond what is currently known. The overview of Table 12.1 shows that NCA can be applied in virtually any area of practice where success must be realized, or risks must be prevented. Most studies have found potentially important necessary conditions on which the practitioner could act. It illustrates that in any specific practical setting necessary conditions can be identified for action.
| X = condition | Y = outcome | Focal unit | |
|---|---|---|---|
| Economics | |||
| 1 | National adoption of support policies and low-intensity agricultural practices | National environmental sustainability performance in the agricultural sector | Agricultural firm |
| 2 | Human capital, institutional business facilities, and market opportunities | Open innovation | Country |
| Education | |||
| 3 | Individual characteristics and study-related behaviors (e.g., conscientiousness, attendance, study time) | Academic success (grades/GPA) | Student |
| 4 | SAT mathematic scores | GPA in mathematics major | Student |
| Entrepreneurship | |||
| 5 | Entrepreneurial role stress | Burnout | Self-employed individual |
| 6 | Entrepreneurial ecosystem domains (e.g., political environment, financing) | Deep-tech entrepreneurship | Country |
| Environmental Sciences | |||
| 7 | Access to and experience of urban nature | Well-being | Urban resident |
| 8 | Planning, goal setting, and R&D capabilities | Eco-innovation | Agricultural firm |
| Human Resource Management | |||
| 9 | High performance work practices | Job satisfaction & managerial effectiveness | Organization |
| 10 | Technostress related to workplace social media use | Work performance | Organization |
| International Business/Management | |||
| 11 | Organizational context (e.g., top management support, technical competencies.) | Stage of adoption of artificial intelligence | Organization |
| 12 | Environmental, social, and governance performance scores | R&D expenditure (innovation) | Multinational life sciences firm |
| Marketing | |||
| 13 | Personality traits | Impulsive buying behavior | Consumer |
| Medicine and Health | |||
| 14 | Metacognition | Motivation | Individual with schizophrenia spectrum disorder |
| 15 | Baseline depressive symptoms, self-criticism, rumination and stressful events | Major depressive episodes across two years | Adolescent |
| Operations and Supply Chain management | |||
| 16 | Critical success factors for lean practices (e.g., leadership, employee involvement, continuous improvement) | Implementation of lean practices in manufacturing SMEs | Manufacturing firm |
| 17 | Formal contracts and interpersonal trust in buyer–supplier relationships | Innovation in buyer–supplier relationships | Buyer-supplier relationship |
| Psychology/Organizational Behavior | |||
| 18 | Satisfaction of basic psychological needs for autonomy, competence and relatedness | Work engagement | Employee |
| 19 | Levels of fear of missing out and social networking addiction | Psychological well‑being of young adults | Young adult |
| Public Administration | |||
| 20 | Delay of first response, political decentralization, elderly populations, and urbanization | Early COVID-19 Mortality | Country |
| 21 | Institutional trust and individualism | COVID-19 first-response stringency | Country |
| Strategy | |||
| 22 | Managers’ strategic myopia | Firm performance | Manager |
| 23 | Market PL-driven orientation | Market-driving orientation | Company |
| Technology | |||
| 24 | Cable features (void fraction and critical current) | Change in current sharing temperature | Twisted Cable-in-Conduct Conductor |
| 25 | Evolutionary conservation | Dynamic cooperativity | Amino acid (protein system) |
| Tourism and Hospitality | |||
| 26 | Positive affect and carefreeness | Eudaimonic experience | Tourist |
| 27 | Organizational capabilities (e.g., transparency, flexibility) | Resilience | Hotel |
| Transportation | |||
| 28 | Favorable meteorological conditions (temperature, precipitation, humidity, wind) | Bike rental demand in Washington, DC | Hour (across a two-year period) |
Note. 1. Lankoski & Lankoski (2023); 2. Galindo-Martin et al. (2025); 3. Tynan et al. (2020); 4. Zhou, Kuncel, et al. (2024); 5. Manchiraju et al. (2023); 6. Dionisio et al. (2023); 7. Allard-Poesi & Massu (2023); 8. Chaparro-Banegas et al. (2024); 9. N. Garg et al. (2019); 10. Wang & Beh (in press); 11. Solaimani & Swaak (2023); 12. Subramanian et al. (2024); 13. Shahjehan & Qureshi (2019); 14. Luther et al. (2017); 15. Marchetti, Koster, et al. (2025); 16. Knol et al. (2018); 17. Van der Valk et al. (2016); 18. H. Ding & Kuvaas (2023); 19. Sirisety et al. (2025); 20. B. Yan et al. (2023); 21. Liu et al. (in press); 22. Czakon et al. (2023); 23. Vu & Tolstoy (2025); 24. Kwon (2021); 25. S. Chong & Ham (2023); 26. W. Lee & Jeong (2020); 27. Ofori (2024); 28. D. Kumar (2021).
12.3 NCA’s contribution to change and innovation
Using NCA in practice means that an action must be taken on identified necessary conditions. NCA does not have its own change or innovation approach, but can add to existing ones. It provides a new perspective by focusing on necessity logic and by selecting and prioritizing (non-)bottleneck cases to be acted on. In this way NCA can add new value to any existing change process be it a classical Plan-Do-Check-Act for continuous improvement, more recent methods for agile product development and management like Scrum, or any other approach that is used in a specific practice.
Each phase of the change process from planning, execution and evaluation can benefit from NCA. NCA can help to decide about the strategic direction of the intervention (focus on must-have and stop factors, and not on nice-to-have factors and average effects). NCA’s analytic tools can help to operationalize these strategies into concrete effective and efficient interventions by identifying which conditions and cases must be acted on. Specifically, NCA clarifies what potential must-have factors must be in place, and what potential stop factors must be removed or reduced, for interventions to succeed.
The development of an NCA-based intervention consists of two main parts. The first part is the intervention strategy, which establishes the team of stakeholders involved in the intervention, sets the goal and target group for the intervention, suggests the drivers and barriers to achieve that goal, and formulates the necessary condition hypotheses for prioritized drivers and barriers to be analyzed further. In this phase, NCA’s strengths as a broader methodological/theoretical approach based on necessity logic are leveraged.
The second part is the intervention design based on a study of a group of cases that represent the target group. For this group, existing or new data are collected for the outcome \(Y\) and the selected barriers and drivers (\(X\)’s) expressed in the hypotheses. These data are analyzed using the standard procedures described in Chapter 9. Based on the results, an effective and efficient intervention can be designed that focuses on bottleneck conditions and bottleneck cases.
The following sections 12.3.1 and 12.3.2 outline the details of these two parts.
12.3.1 Part 1: Intervention strategy
12.3.1.1 Establishing the team
After a decision has been made to include NCA in the change process, the NCA-based intervention approach can be integrated as follows. It is assumed that a broad team consisting of stakeholders that affect or are affected by the intervention, is established to allow a successful change project. Having a broad team is not only the common advice for successful change, it is also particularly important for an NCA-based intervention as different stakeholders may have different views on the goals, target outcome and target group of the intervention. Having a diversity of stakeholders helps to avoid that important drivers and barriers (potential necessary conditions) are overlooked (see below). In a business environment, for example, a diverse team could consist of representatives from strategy, marketing, operations, customer services and business analytics, etc., who all could have a different stake in the intervention project and have different views about important necessary conditions.
It can be helpful to assign one team member to focus specifically on the necessity perspective, ideally as a rotating role so everyone develops this skill. During change processes and team discussions, it is easy to lose sight of necessity logic or to slip back into probabilistic sufficiency thinking. A designated team member helps keep the group attentive to necessity-oriented reasoning and supports the collective learning process.
12.3.1.2 Establishing the goal and target group
The intervention goal must be clearly defined and preferably shared among all those involved in the design and implementation of the intervention. The goal specifies the intended result of the intervention, and specifies the desired or undesired outcome. Whenever possible, a specific target outcome is to be expressed quantitatively. This could be a specific level of the outcome that should be achieved (desired outcome) or prevented (undesired outcome). It is also possible to express this level in terms of the percentage of cases that should be able to achieve the outcome or be prevented from having the outcome. Such a quantification of the goal helps to guide the second part of intervention development: the intervention design. The target group is the broader collection of cases for which the intervention goal is set. It may be that for reasons of effectiveness and efficiency, only part of the cases from the target group (the intervention group) will actually receive the intervention (see below).
12.3.1.3 Establishing drivers/barriers
Based on the team’s knowledge, a list of potential drivers and barriers to achieve the goal is developed through a creative process, for example brainstorming. The goal is to have a long list of potential drivers and barriers for the outcome. If there are multiple outcomes, each outcome has its own list of drivers and barriers. Drivers and barriers are identified based on the team members’ expert knowledge and experience, and possibly academic knowledge (see Section 7.4). The reason for this important step is that, in contrast to interventions based on for example big-data or AI-based approaches, an NCA-based intervention is selective and transparent regarding the conditions and cases to be acted on. It only focuses on crucial conditions and relevant cases in order to be effective, efficient, and avoid waste of resources.
12.3.1.4 Formulating necessity hypotheses
The goal of this phase is to reduce the number of drivers and barriers to the essential ones: the potential necessary conditions. Often the number of drivers and barriers that are developed in the previous phase is large. However, many drivers and barriers are “just” important from the perspective of probability and average effects, but not from the perspective of necessity. Through a careful evaluation of the drivers/barriers, it is possible to identify the potential necessary conditions. This evaluation requires a team discussion, and results in a selection of drivers and barriers that the team considers necessary conditions for achieving the goal. If the set of necessary conditions is still large, prioritization may be needed, in particular when an NCA-based intervention is new to the team.
The intervention development continues with the selected potential necessary conditions. For each necessary condition a preliminary necessity hypothesis is formulated and further developed toward a formal necessity hypothesis, as outlined in Chapter 7. For example, this phase specifies variables \(X\) (measurable drivers/barriers) and \(Y\) (measurable goal), or the selection of a group of cases where the hypothesis is expected to apply (entire target group, selection of target group, or beyond the target group). This information is important for data collection (in Part 2 of the intervention) and the design of an effective intervention. The team should critically evaluate whether the potential necessary condition is causal: if the single condition is removed, will the target outcome not be possible? An intervention only works if the condition is causal (see Chapter 2). Since causality cannot be observed, the hypothesis should make causality plausible. If not, the necessary condition, is not a candidate for an intervention based on necessity causal logic.117
The result of the strategic phase is one or more causal necessary condition hypotheses formulated as \(X\) is necessary for \(Y\) where \(X\) is the set of expected necessary drivers or barriers, and \(Y\) is the desired or undesired target outcome (possibly with quantification of the level of the target outcome).
12.3.2 Part 2: Intervention design
An evidence-based intervention is based on an established relationship supported by empirical data. For an NCA-based intervention this means that the team’s formulated formal necessary conditions hypotheses is tested with archival or new data obtained about \(X\) and \(Y\) from the target group, or from a group that is representative for the target group. The aim of this analysis is to find the condition thresholds that are assumed to apply to the entire target group. This is the basis for the intervention in the target group.
Specifically, each hypothesis that is selected in the previous phase is tested to evaluate if the hypothesis is supported and the condition is indeed necessary. If necessity holds, an \(XY\)-plot similar to Figure 12.1-right is generated to observe where the ceiling exists and which cases are inside or outside of the bottleneck area. Once the target conditions for the target outcome are estimated, the intervention focuses on removing cases from the bottleneck area (if the outcome is desirable) by increasing the value of the necessary conditions, or moving cases into the bottleneck area (if the outcome is undesirable) by decreasing the value of the necessary condition. Different intervention designs are possible depending on whether it focuses on all or a selection of cases, and on all or a selection of necessary conditions.
It may be concluded that only a specific group of cases from the target group should receive the intervention to benefit from it (intervention group). An effective and efficient intervention focuses only on cases in the target group that have condition levels below the threshold (if the target outcome is desired) or have condition levels above the threshold (if the target outcome is undesired).
12.3.2.1 Data collection
A sample of the target group or another group of cases that is representative for the target group is selected for testing the hypothesis. For each case in the sample, scores for \(X_j\) (\(j\) is the specific index of a necessary barrier/driver) and \(Y\) must be available. For proper results, the data must be reliable (same score for repeated measurements under the same circumstances) and valid (scores must correspond to the meaning of the variables in the hypothesis) (Chapter 8).
12.3.2.2 Data analysis
After data collection the data are analyzed according to NCA’s standards (Chapter 9). Each hypothesis is rejected or supported (= not rejected). If supported, the condition is considered for the NCA-based intervention. If rejected, the condition may be “just” a contributing factor but is not essential.
12.3.2.3 Displaying crucial results
For each supported hypothesis, the cases are shown in an \(XY\)-plot. In the example of Figure 12.3-left, five cases (A-E) are shown.
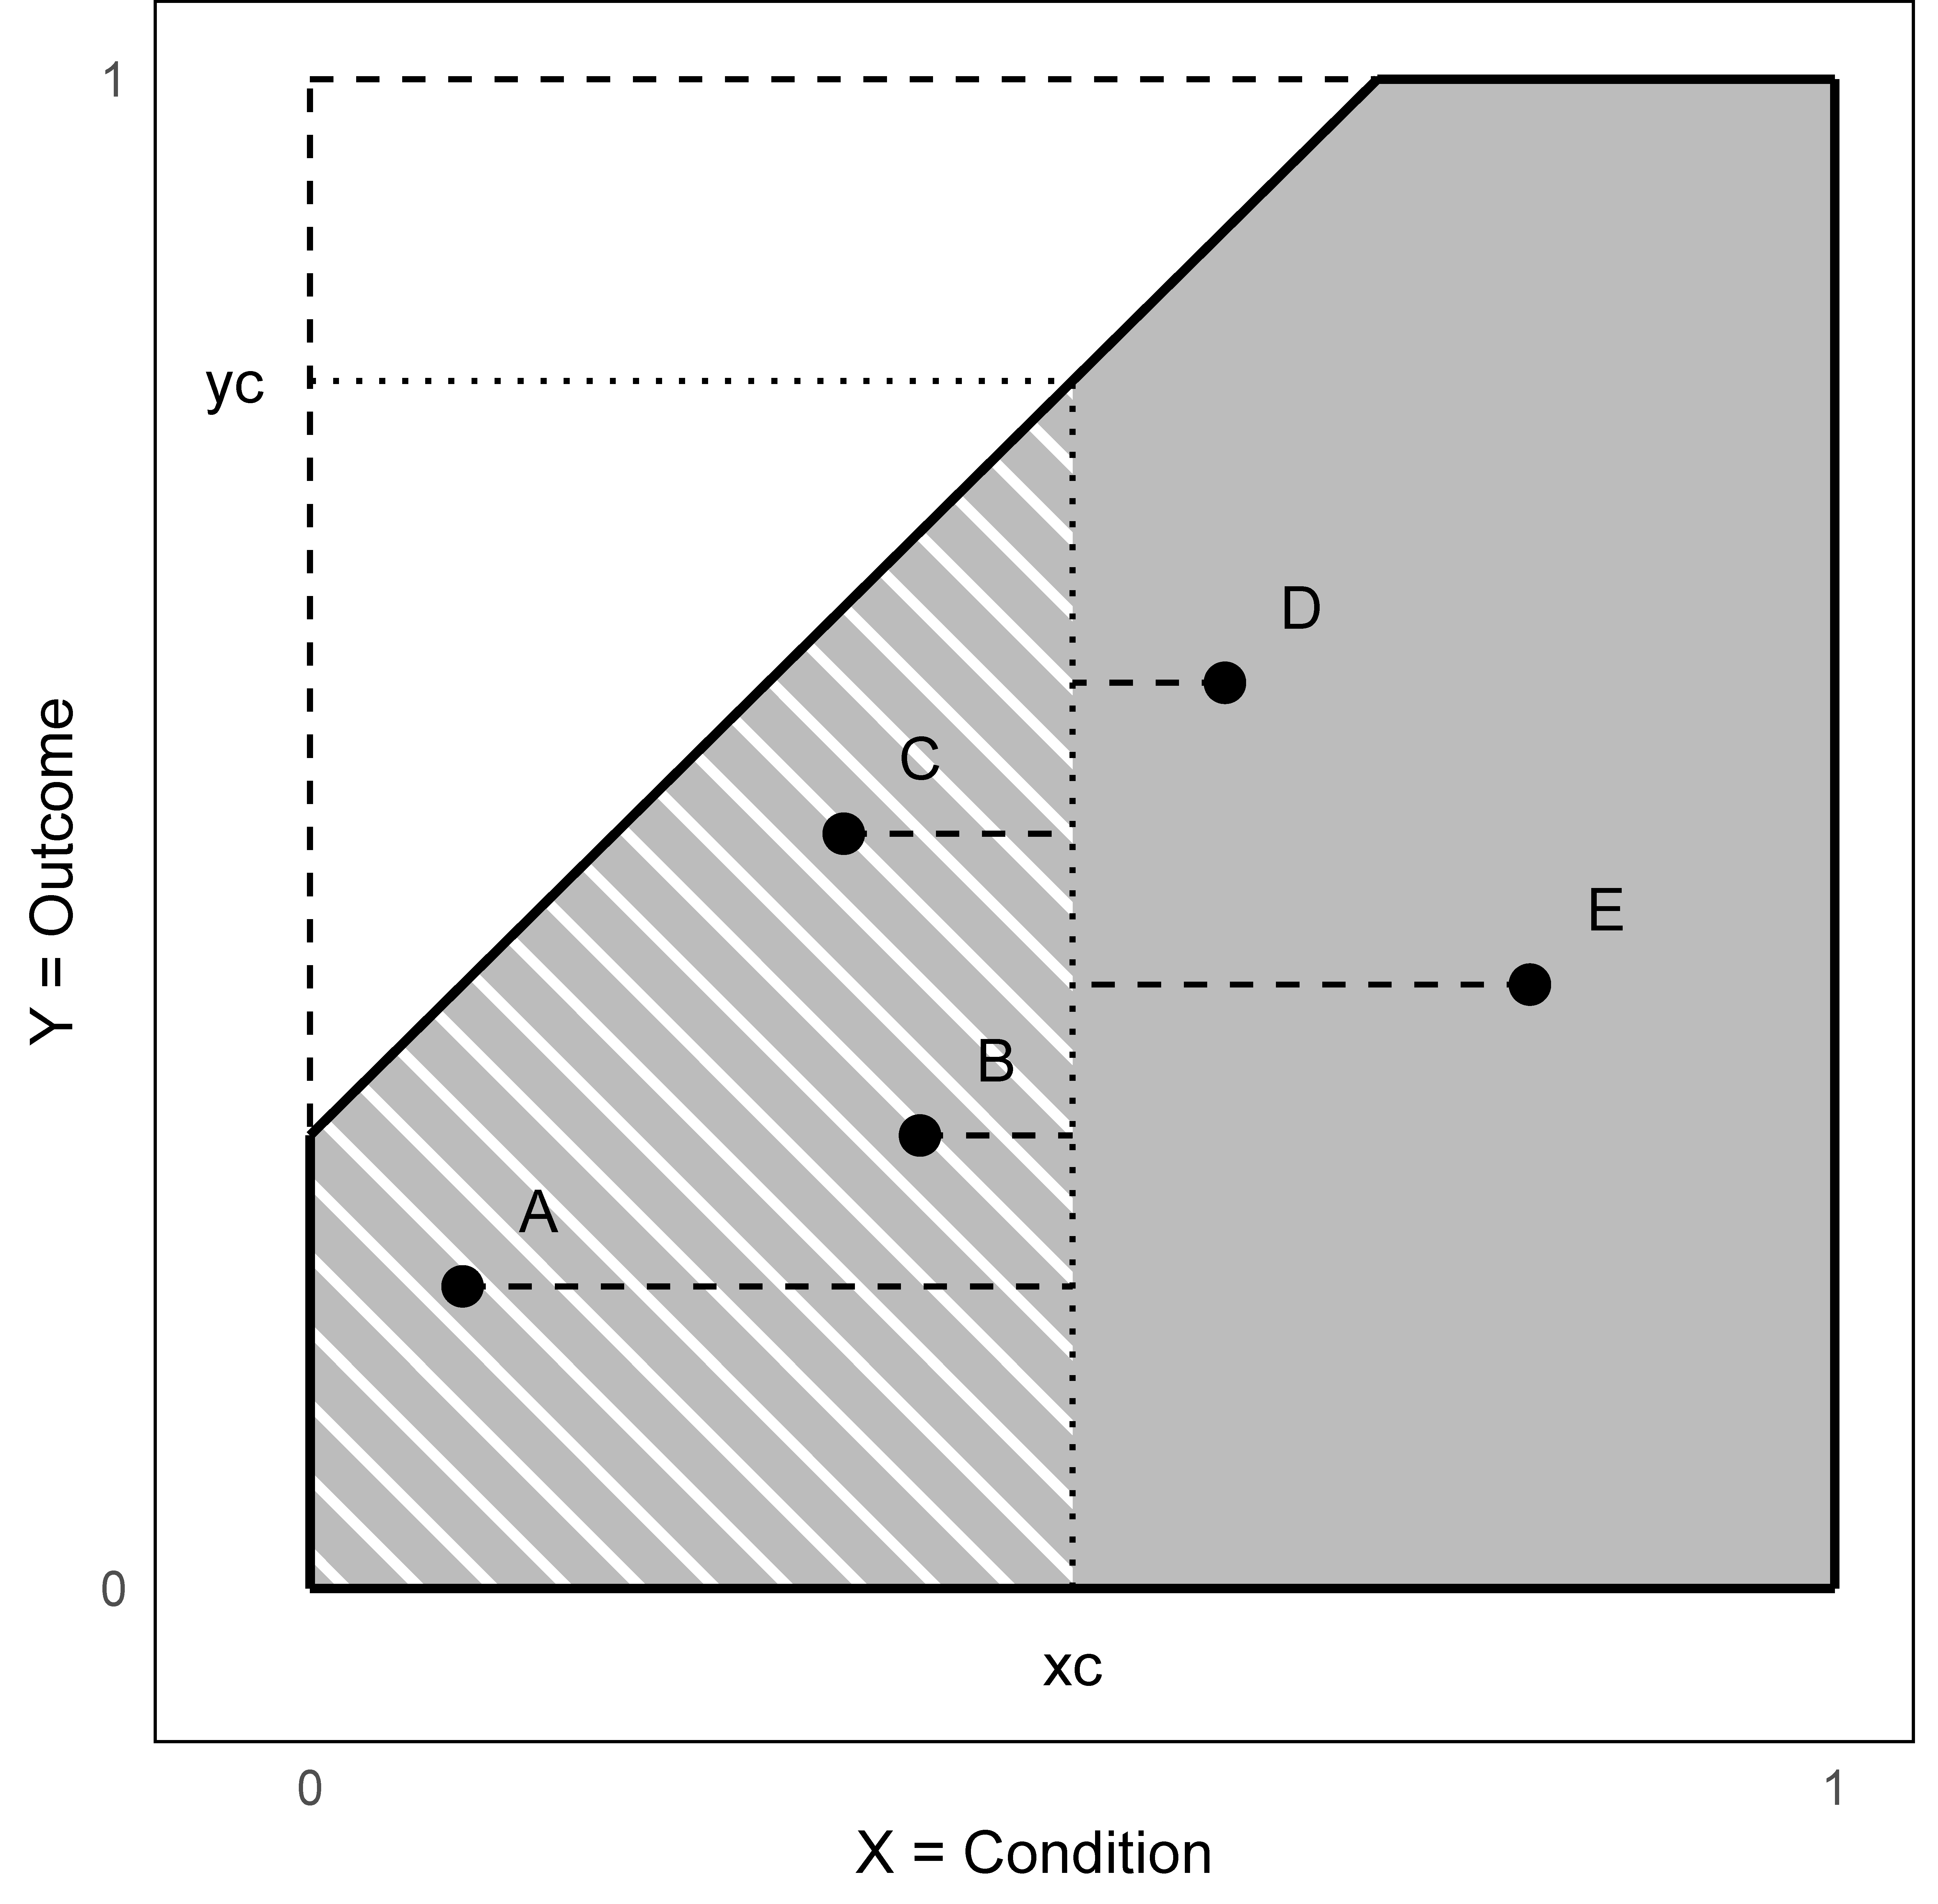
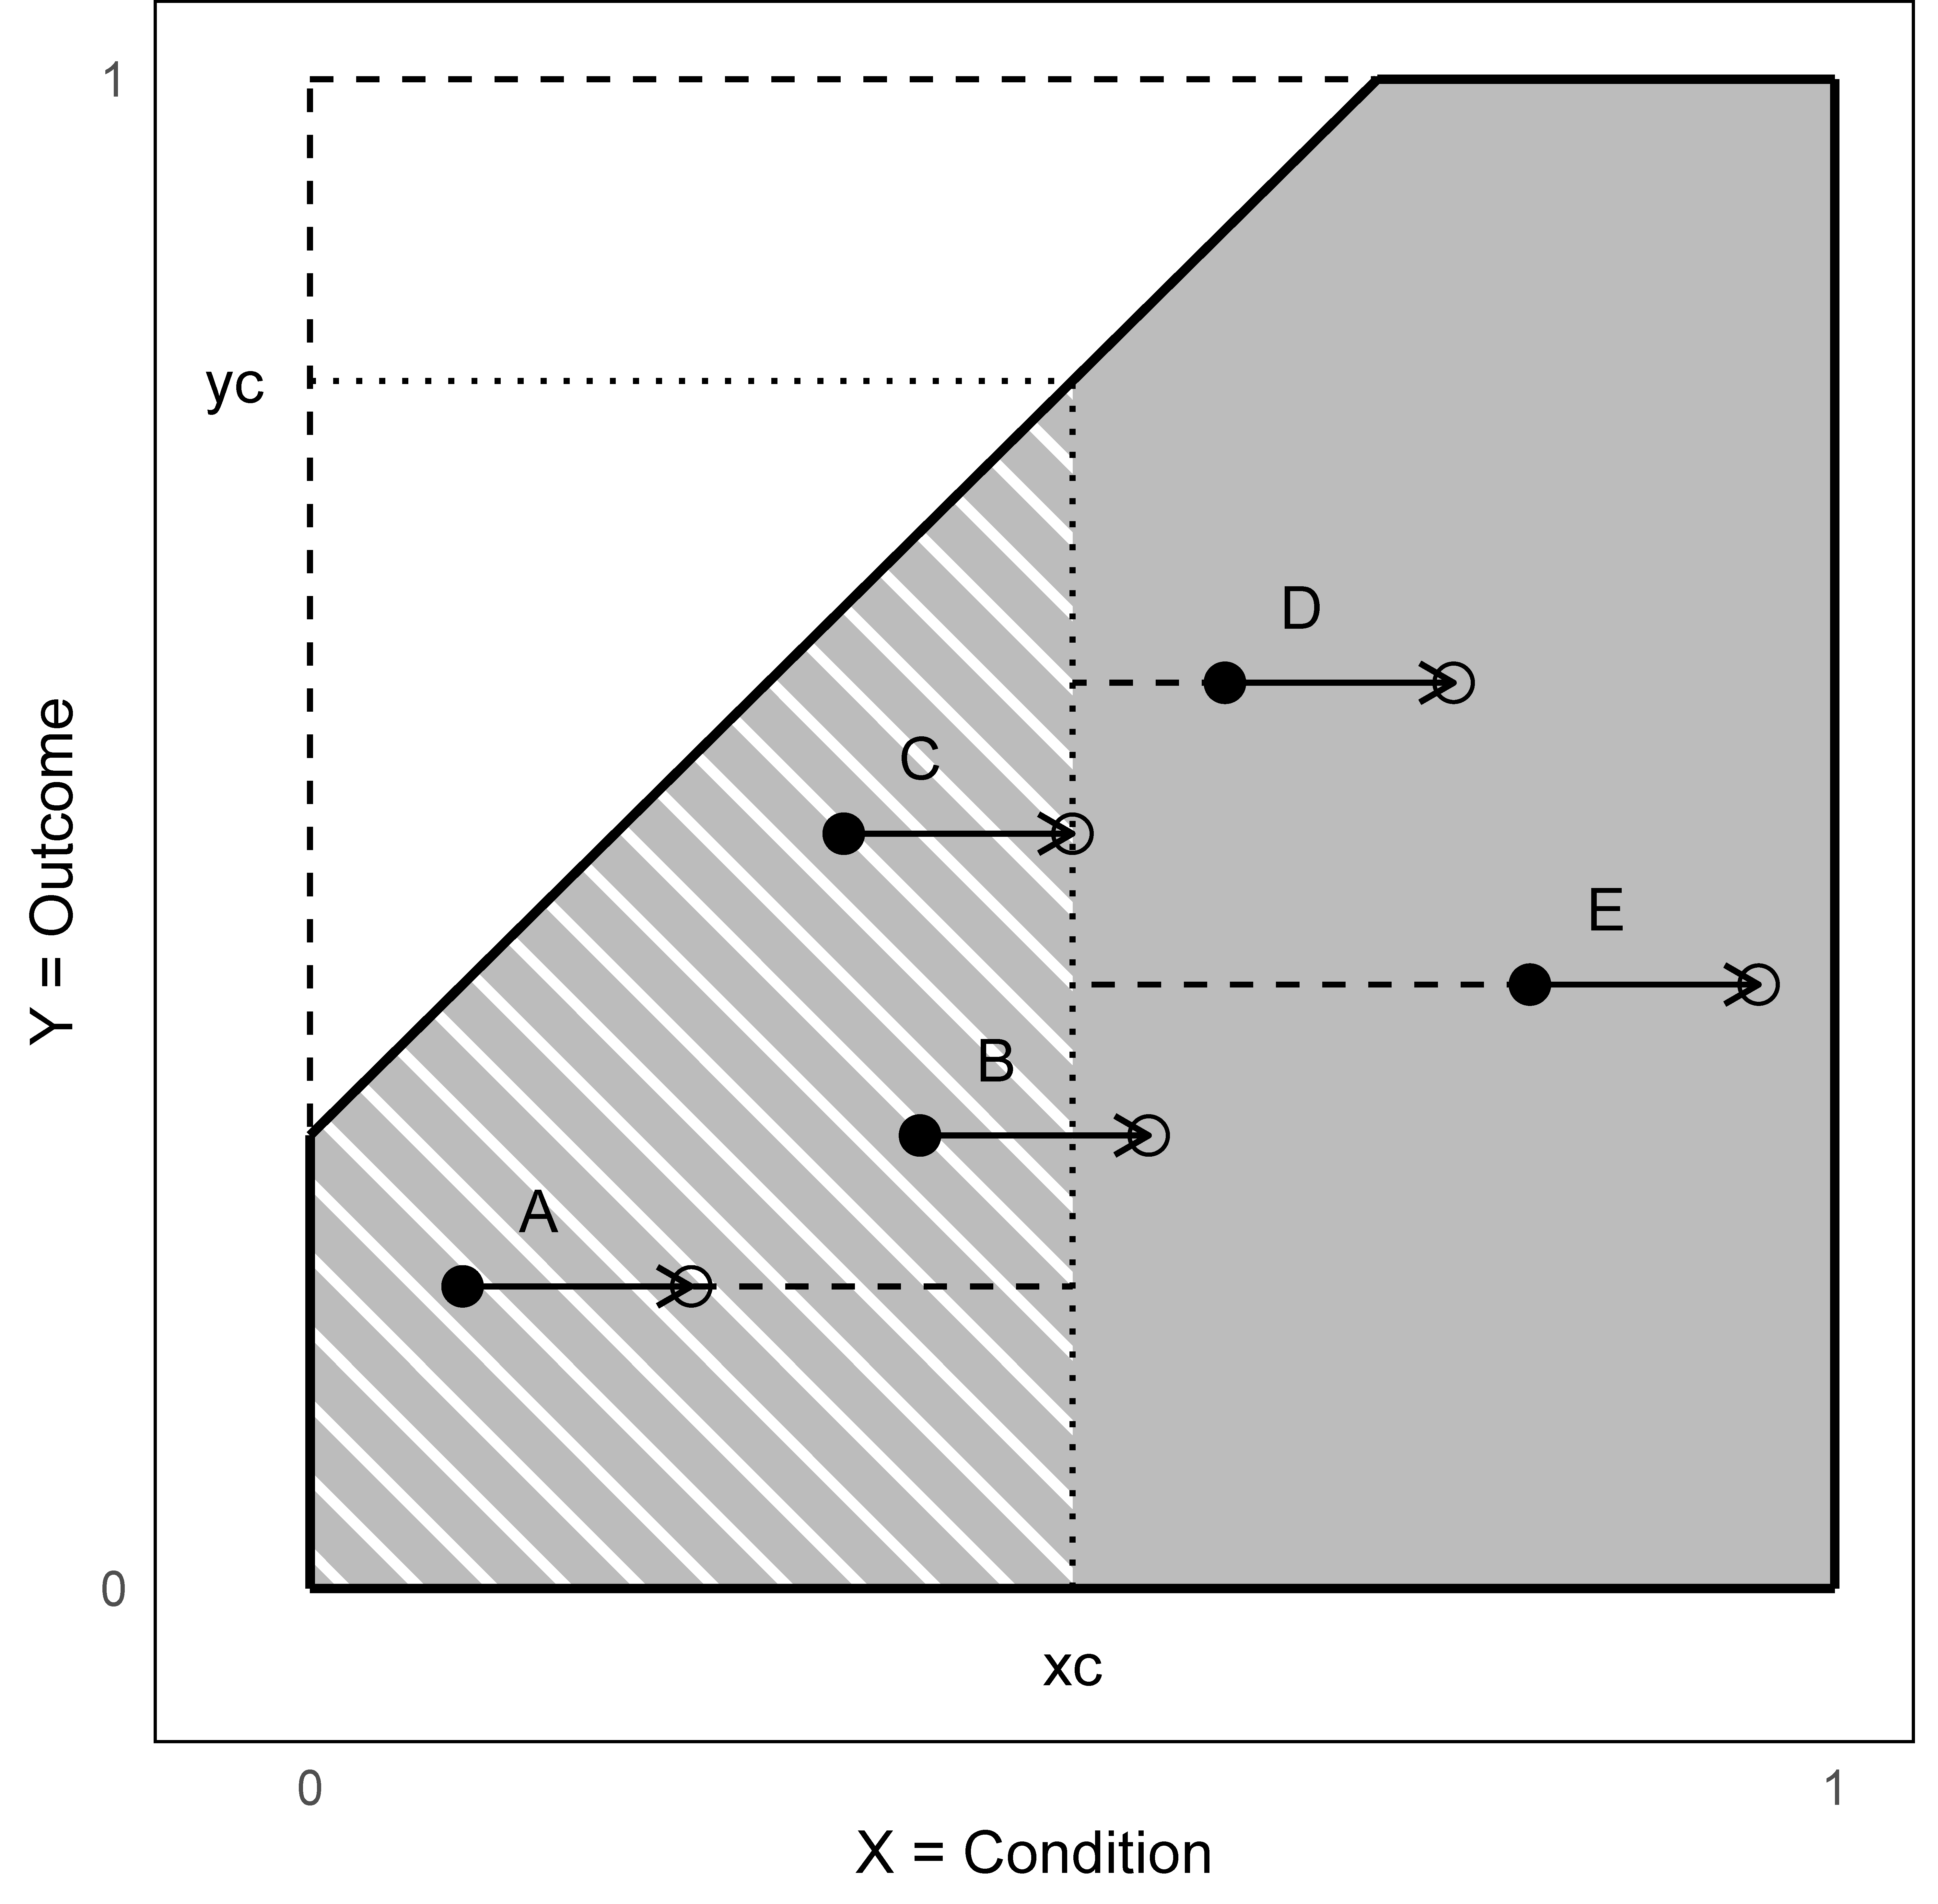
Figure 12.3: \(XY\)-plot with ceiling line, target outcome \(y_c\), target condition \(x_c\), and five cases. Left: dashed lines are the bottleneck distances; Right: A generic intervention on all cases.
In this plot, the condition \(X\) is displayed on the horizontal axis, the outcome \(Y\) on the vertical axis, and the five cases with specific \(X\)- and \(Y\)-values are displayed as dots. The plot also shows the estimated ceiling line, separating the white ceiling zone (empty space) where cases are impossible from the gray feasible area below the ceiling line where cases are possible. In the plot, the target level \(Y\) = \(y_c\) and the corresponding target condition level \(x_c\) are displayed as well. These points indicate that level \(x_c\) of \(X\) is necessary for target outcome \(y_c\) of \(Y\). The threshold value \(x_c\) defines the bottleneck area. Cases in this area are the bottleneck cases that cannot reach the target outcome \(y_c\) unless their condition \(X\) is increased to \(x \geq x_c\).
In Figure 12.3-left, cases A, B, and C are bottleneck cases (\(x < x_c\)) and cases D and E are non-bottleneck cases. For the latter, \(y = y_c\) is achievable from the perspective of this \(X\). The bottleneck distance is the horizontal distance from a case to the target value \(x_c\), indicated by a dashed line. If the outcome is desirable, cases A, B and C cannot achieve the desired outcome \(y_c\). These cases must overcome the bottleneck distance to make \(y_c\) possible. For case A more intervention effort is needed to overcome the bottleneck distance (larger bottleneck distance) than for cases B and C.
12.4 Interventions for making desired outcomes possible
When the outcome is desirable, cases inside the bottleneck area (bottleneck cases) should be removed from it by increasing the condition value. For example, when it was found that students’ study time \(X\) is necessary for exam grade \(Y\), and a certain target pass grade \(y_c\) can only be achieved with at least \(x_c\) study time, the intervention consists of motivating students with study time \(x < x_c\) to increase their study time to \(x \geq x_c\).
Figure 12.3-right shows an example of in intervention to make a desired target outcome possible. The intervention consists of a generic condition increase of 0.15 (15% of the range of 1.00) and is applied to all five cases.
12.4.1 Intervention effort
An intervention effort is an externally applied change of the value of the necessary condition. The effort is applied to a case from the target group. A case to which the intervention is applied is called an intervention case. For practical or strategic reasons, it may be that not all cases from the target group are intervention cases. The total intervention effort is the sum of efforts applied to the intervention cases. The example of Figure 12.3-right shows that the generic intervention is applied to all five cases, such that all these cases are intervention cases. The total intervention effort is 5 × 0.15 = 0.75.
An effective case is an intervention case that was in the bottleneck area before the intervention and left that area due to the intervention effort. An ineffective case is an intervention case that was in the bottleneck area before the intervention, but did not leave the area despite the intervention effort (the effort was too small). An irrelevant case is an intervention case that was not in the bottleneck area before and also not after the intervention. An ignored case is a bottleneck case to which an intervention is not applied.
So, an effective case is a bottleneck case that becomes a non-bottleneck case after intervention. An ineffective or ignored case stays in the bottleneck area, and an irrelevant case stays in the non-bottleneck area.
Figure 12.3-right shows that bottleneck cases B and C are effective cases as they left the bottleneck area. Case A is an ineffective case and cases D and E are irrelevant cases.
12.4.2 Intervention effectiveness, waste and efficiency
The goal of an NCA-based intervention is to move the bottleneck cases out of the bottleneck area by raising their condition value to at least the target condition level. Intervention effectiveness is the share of treated bottleneck cases (that received the intervention) that leave the bottleneck area after the intervention (effective cases). These are cases that, after intervention, have a condition value at or above the target condition level and are therefore no longer constrained by that condition in achieving the target outcome. Cases that were already outside the bottleneck area before the intervention are irrelevant cases with respect to this goal.
\[\begin{equation} \text{Intervention effectiveness}=\frac{\text{Number of effective cases}}{\text{Number of treated bottleneck cases}}\times 100\% \tag{12.1} \end{equation}\]
In Figure 12.3-right, all five cases received the intervention. Two of the three bottleneck cases leave the bottleneck area; moving case A out of the bottleneck area is not successful. The effectiveness is therefore (2/3) × 100% = 66.7%. After the intervention, four cases are non-bottleneck cases and are able, in principle, to achieve the desired outcome.
Intervention waste is the amount of intervention effort that does not contribute to moving cases out of the bottleneck area. It has three components: (1) undershoot, effort on bottleneck cases that remain bottlenecks; (2) overshoot, effort on effective cases beyond the minimum required effort to reach the target condition; and (3) irrelevant effort on cases that were not bottlenecks before the intervention. In Figure 12.3-right, case A is ineffective because its bottleneck distance (\(x_c - x\)) exceeds the intervention effort, producing 0.15 waste due to undershoot. Case B is an effective case but shows 0.05 waste due to overshoot. Cases D and E are irrelevant cases, producing 0.30 waste. Total waste is therefore 0.50. Case C is the only effective case without waste.
Intervention efficiency is the share of total intervention effort that is effective (i.e., not wasted) in removing cases from the bottleneck area. It is the complement of waste and is expressed in percentages:
\[\begin{equation} \text{Intervention efficiency}=\frac{\text{Total intervention effort}-\text{Total waste}}{\text{Total intervention effort}}\times 100\% \tag{12.2} \end{equation}\]
In Figure 12.3-right, total intervention effort is 0.75 and total waste is 0.50, so intervention efficiency is (0.75 − 0.50) / 0.75 × 100% = 33.3%.
Evidence-based action following NCA focuses on reducing bottleneck distances by increasing cases’ condition values to the target condition level or above (\(x \geq x_c\)), thereby removing the bottleneck and enabling attainment of the target outcome \(y_c\).
12.4.3 Ideal intervention
It is clear that with an effectiveness of 66.7% and an efficiency of 33.3% the intervention is not ideal. The reason is twofold:
The intervention is applied to all cases, rather than to the cases in the bottleneck area only.
The intervention effort is the same for all cases.
An ideal NCA-based intervention strives for 100% effectiveness and 100% efficiency (and 0% waste) so that the intervention goals can be achieved with minimum effort. This can be achieved with a selective intervention that only focuses on cases in the bottleneck area and provides case-specific intervention efforts corresponding to the distance of the case to the condition threshold required for the target outcome.
For the example of Figure 12.3-right, this can be achieved by an intervention design with the following efforts:
Case A: 0.40
Case B: 0.10
Case C: 0.15
Case D: 0
Case E: 0
An ideal intervention targets bottleneck cases that is just enough to be 100% effective and 100% efficient. Some overshoot might be desirable as “safety margin.” Although effectiveness would remain 100%, efficiency would slightly decrease as the price for more resilience.
The practical advice for an NCA-based intervention is:
Apply the intervention only to cases in the bottleneck area: the cases that are constrained by the specific condition: Act only where something is blocking improvement, and do not intervene where no real bottleneck exists.
Match the intervention effort to the case’s need. Each case in the bottleneck area has a bottleneck distance indicating how far it is from its target. Rather than a one-size-fits-all approach, the tailored approach overcomes the case’s bottleneck distance: how far it is from the target. The intervention effort reflects that distance: the larger the distance the stronger the effort.
For quick results start with the easiest cases first: those that are closest to the target condition.
The potential of an NCA-based intervention compared to an average effect-based intervention can be illustrated as follows. Suppose an organization with 500 employees sets new performance goals (target \(Y\)). To be able to achieve that goal, employees must have a higher skill level (target \(X\)). An average effect analysis finds that higher skills increases performance on average, and an NCA analysis finds that skill is necessary for performance. Based on the average effect results the whole group of employees receives an intervention consisting of a skill training. The training results in each person’s skill increase of 0.15 units. This situation corresponds to Figure 12.3-right where each point stands for a group of 100 employees with the starting same skill level. Suppose further that the training costs 1,000$ per unit skill increase (intervention effort). Consequently, a person’s 0.15 skill increase costs 0.15 × 1,000 = 150$. The total intervention effort is therefore 500 × 0.15 = 75, such that the total intervention costs is 75 × 1000 = 75,000$ (or 500 persons × 150$ = 75,000$).
After the intervention, 400 employees have the required skills to make the target outcome possible (employees of groups B, C, D, E). For group A the intervention effort was not strong enough to become non-bottleneck cases. Groups D and E were already non-bottleneck cases before the intervention. Thus, 200 from the 300 employees that were in the bottleneck area and received the intervention left that bottleneck area. Therefore, the effectiveness of the intervention is 200/300 × 100% = 66.7%.
Part of the total intervention effort of 75 is wasted. All effort for group A is wasted due to undershoot (100 × 0.15 = 15 waste). A part of the effort for group B is wasted due to overshoot (100 × 0.05 = 5 waste), and the entire effort for groups D and E is irrelevant and is thus wasted (200 × 0.15 = 30 waste). The efficiency of the intervention is therefore (75 – 50) / 75 × 100% = 33.3%).
Suppose now that the intervention is based on the NCA study. The NCA-based intervention focuses only on bottleneck cases and takes bottleneck distances into account. Suppose further that a person’s skill improvement is maximized to 0.15 (or maximum training cost per person of 150$). Therefore, the NCA-based intervention does not select group A for intervention because this group is too far from minimum required skill level for achieving the target outcome, given the maximum budget per person. This intervention also does not select groups D and E as these groups have already enough skills.
The NCA-based intervention gives an intervention effort of 0.10 to group B and 0.15 to group C. This means that the total intervention effort is (100 × 0.10) + (100 × 0.15) = 25. The total intervention costs = 25 × 1000 = 25,000$. While after intervention the same number of employees (400) have the required skills for making the new target outcome possible, the intervention costs are considerably lower. The intervention effectiveness and efficiency are both 100% because all 200 cases in the bottleneck area that received the intervention were effective (100% effectiveness) and the intervention does not produce waste (100% efficiency).
The results are summarized in Table 12.2.
| Average effect intervention | NCA-based intervention | |
|---|---|---|
| Intervention costs | $75,000 | $25,000 |
| Intervention effectiveness | 66.7% | 100% |
| Intervention efficiency | 33.3% | 100% |
12.5 Interventions for preventing undesired outcomes
In the previous section it is assumed that the outcome is desirable. If the outcome is undesirable, the target outcome is the maximum allowable level of undesired outcome. When the outcome is undesirable, cases outside the bottleneck area (non-bottleneck cases) should enter the bottleneck area by decreasing the condition value. For example, it was found that adolescent rumination (overthinking) may be necessary for depression (Marchetti, Koster, et al., 2025). Adolescents are not at risk for a clinically relevant depression level \(y_{c}\) when the rumination level is below \(x_{c}\). Here, the intervention consists of decreasing adolescents’ rumination to below \(x_c\) so that their level of depression \(y_c\) does not occur.
Figure 12.4-right shows an example of a generic intervention to reduce the condition value by 0.15.
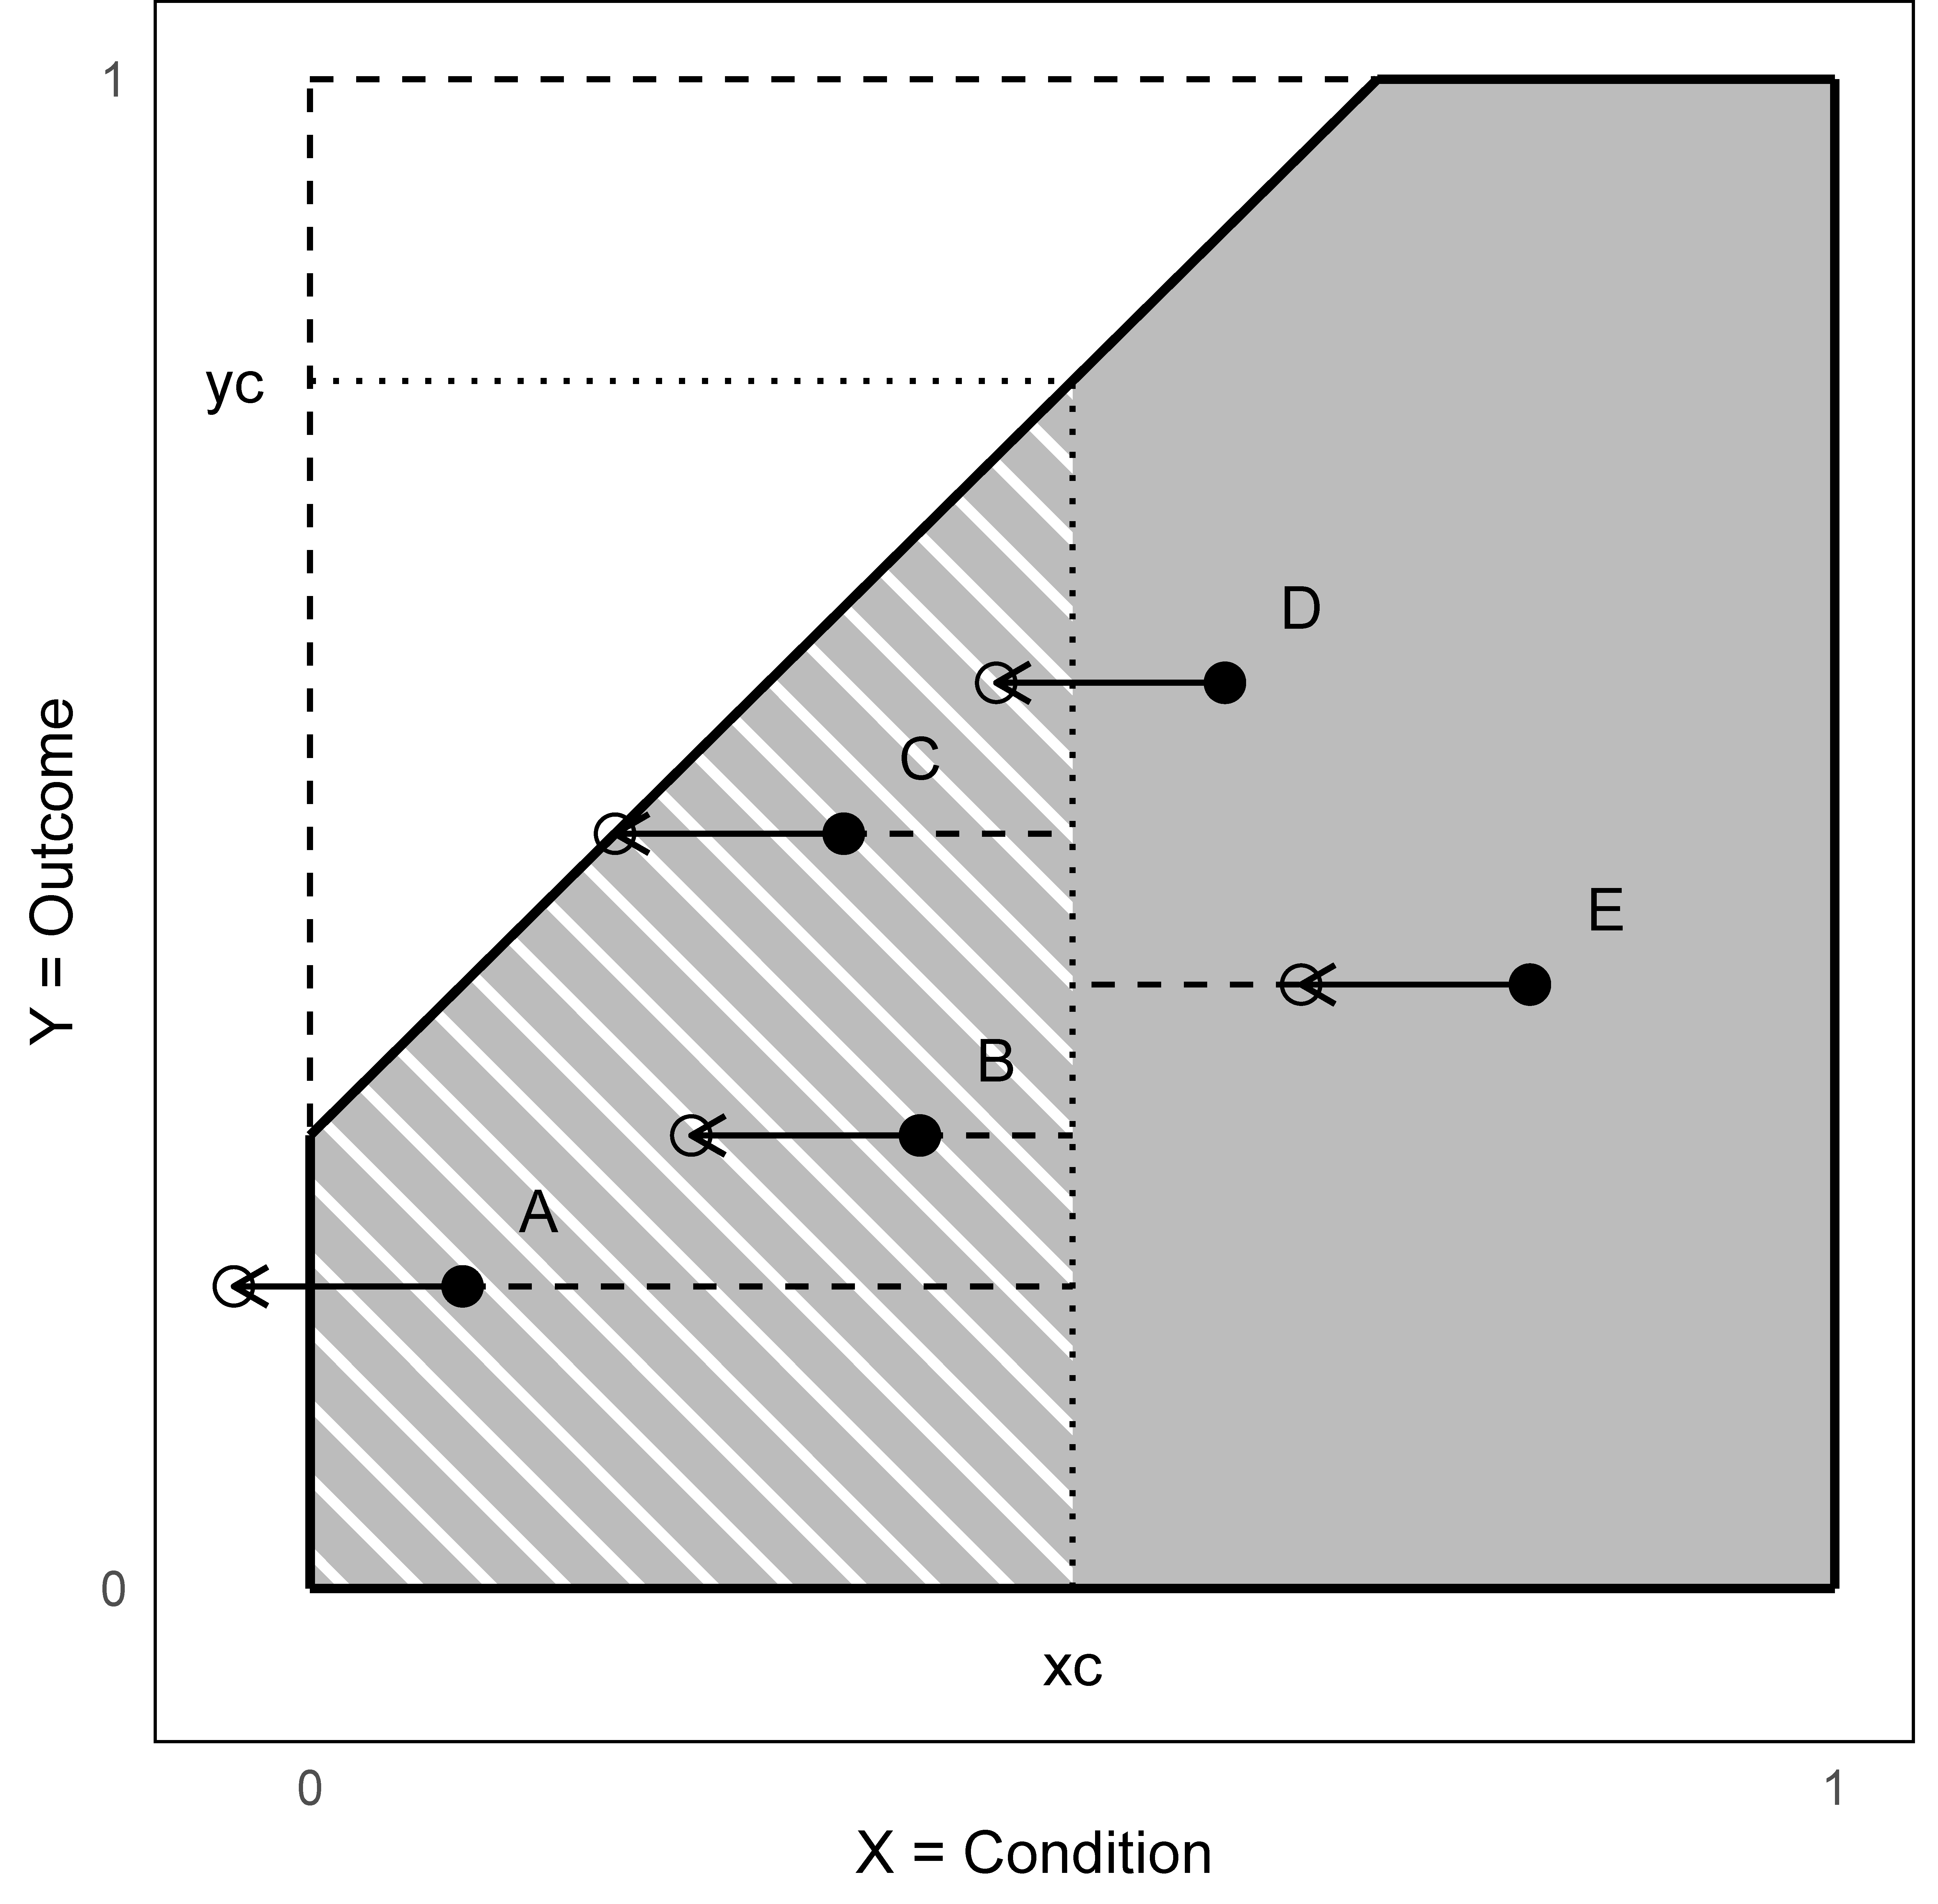
Figure 12.4: \(XY\)-plot with ceiling line with undesired target outcome \(y_c\), threshold condition \(x_c\), and five cases. Left: dashed lines are the bottleneck distances; Right: A generic intervention on all cases.
Cases A, B, and C are in the bottleneck area. This means that they are protected against level \(y_c\) of the undesired outcome and their intervention efforts are a waste. However, cases D and E are at risk. To protect these cases against the undesired level \(y_c\), an intervention effort is needed to reduce their \(x\)-levels toward a safe level of \(x < x_c\). To achieve this goal, more effort is needed for case E compared to case D. However, the generic effort on case D produces some waste, whereas the intervention effort for case E is not enough to bring this case to the bottleneck area.
An ideal NCA-based intervention (100% effective and 100% efficient) for preventing the undesired target outcome is possible when providing the following intervention efforts:
Case A: 0
Case B: 0
Case C: 0
Case D: −0.10
Case E: −0.30
Evidence-based action, based on the results of NCA, implies designing an intervention that moves cases into or out of the bottleneck area. The goal is to increase or decrease the condition value of cases in order to avoid or ensure that cases are in the bottleneck area, depending on whether the outcome is desirable or undesirable.
12.6 Interventions with multiple necessary conditions
The situation of multiple necessary conditions may be more complex. Each condition has its own bottleneck area and it may be that a case is present in more than one bottleneck area. For a desired outcome (having the possibility to achieve the target outcome), a case must leave all bottleneck areas. If the intervention is focused on a specific condition, but the case is also constrained by another condition that is not intervened on, it will not be effective. For a desired outcome, information must be available for all multiple necessary conditions and all conditions must be considered when designing an intervention.
For an ideal intervention (100% effective and 100% efficient) with multiple necessary conditions, two approaches can be used (Table 12.3): The case-focused intervention strategy focuses on all conditions in one case at the same time and then moves to the next case (parallel on conditions, sequential on cases). It addresses bottleneck conditions together. The intervention can start with the easiest cases. These are the cases with the lowest (weighted) total bottleneck distance for all conditions.118.
The condition-focused intervention strategy focuses on one condition at a time, across all cases (parallel on cases, sequential on conditions). The intervention begins with the condition that has the greatest impact. This is the condition with the largest number of single bottleneck cases. Then the intervention moves to the next condition in order of how many single-bottleneck cases it affects, etc. The BIPMA approach discussed in Section 11.4.1 is an example of a condition-focused intervention.
| Work on … | Prioritize … | |
|---|---|---|
| Case-focused | All conditions in one case, one case after another | Cases from low to high bottleneck distance |
| Condition-focused | One condition after another across all cases | Conditions from high to low number of single bottleneck cases |
For an undesired outcome (having no possibility to achieve the target outcome), a case must be in any bottleneck area. If the intervention focuses on a specific condition, a case that enters the bottleneck area is effective, regardless of whether the case is outside the bottleneck area of another condition.
| Work on … | Prioritize … | |
|---|---|---|
| Case-focused | Selected condition in one case, one case after another | Cases from low to high bottleneck distance |
| Condition-focused | One condition across all cases | Preferred condition with lowest number of bottleneck cases |
In practice it may not be possible to act on all bottleneck cases, to apply case-specific intervention efforts, or to act on all bottleneck conditions. This will negatively affect the effectiveness and efficiency of the intervention.
When developing interventions based on bottlenecks, the following general advice can be given to practice:
Be selective: only act in bottleneck areas.
Be proportional: match effort to bottleneck distance.
Be strategic: choose the right sequencing of the intervention.
12.7 Illustrative example
The illustrative example describes a stylized and partly constructed situation (with existing data).119 A company wants to improve the frequency of use of a recently launched technological product for daily use. Data from 174 customers show that the product is not used as frequently as expected (Figure 12.5).
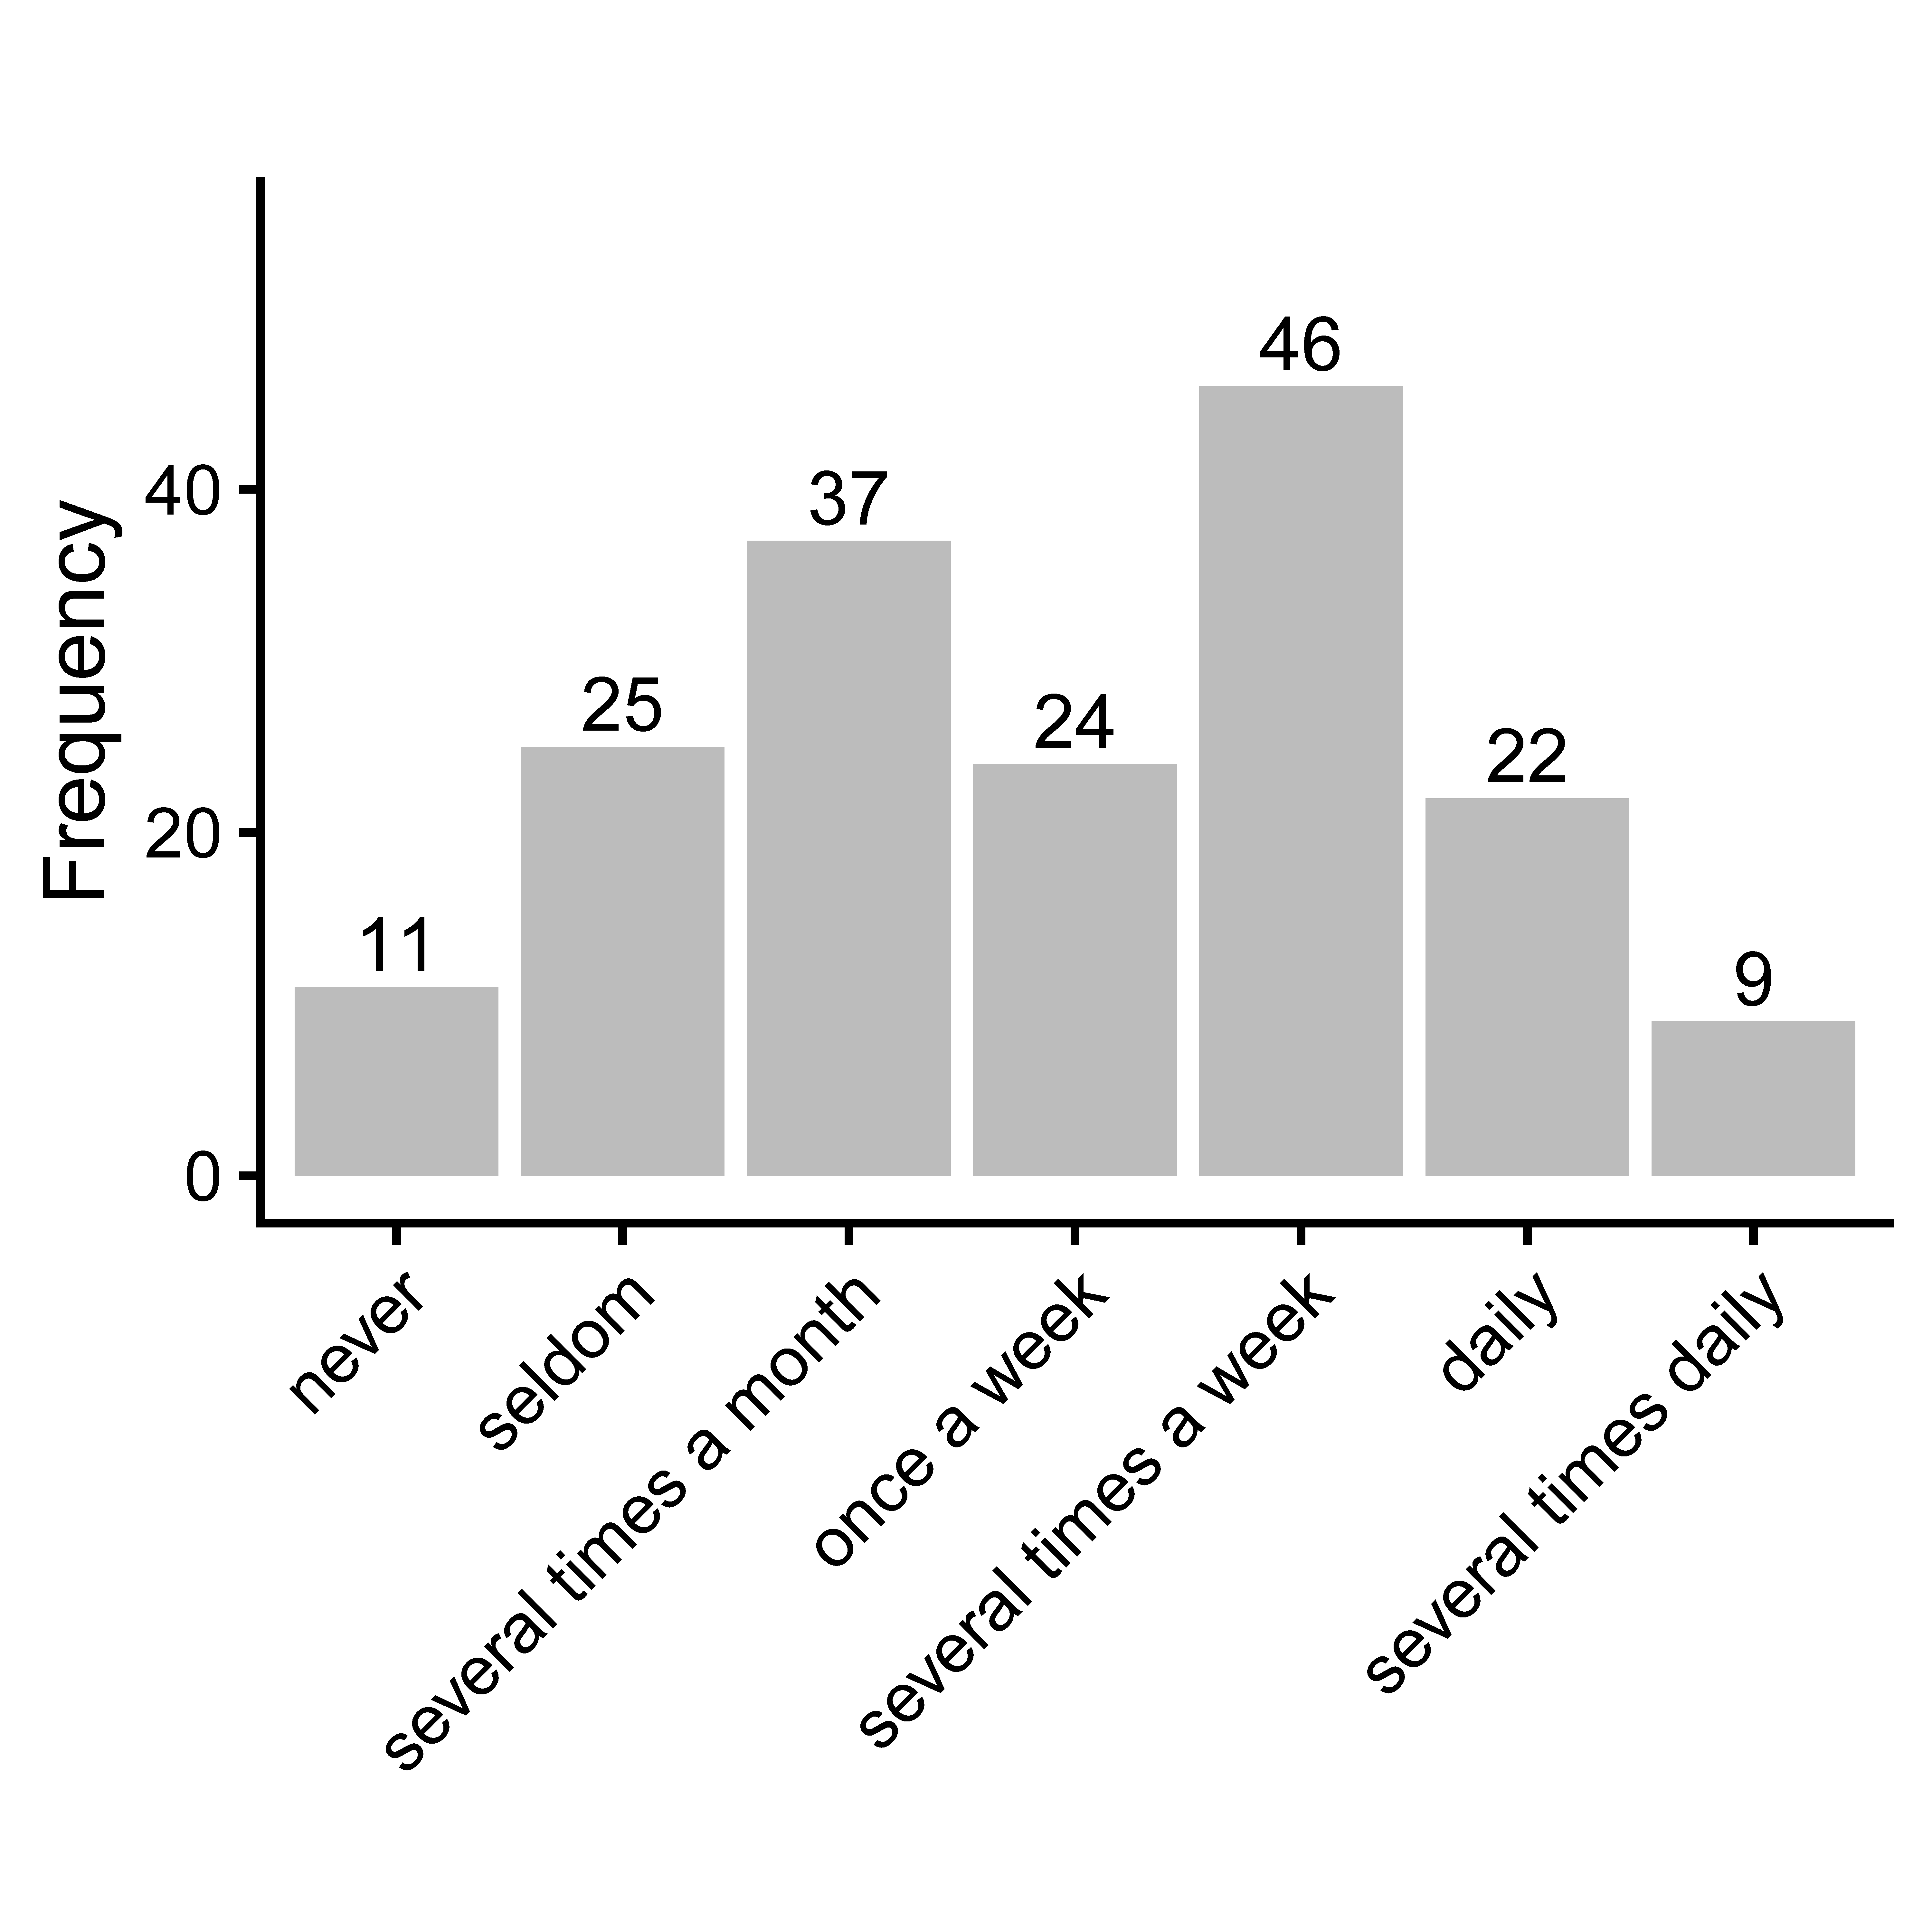
Figure 12.5: Example: Frequency of product use by 174 customers.
The company wants to improve this product use with an NCA-based intervention approach. The target outcome is daily use of the product.
12.7.1 Example Part 1: Intervention strategy
In part 1, the intervention strategy is defined. The company establishes a team with representatives from marketing, new product development, operations and customer services. The team follows the change strategy that is common in the organization. One of the team members takes the role of the necessity-perspective-advocate and ensures that this perspective is applied and safeguarded during the process. This role is rotated among team members for learning purposes. The team establishes the goal of daily product use. Via brainstorming sessions the team identifies causal factors related to limited product use, in particular factors that the company can influence. The team identifies the following drivers and barriers that relate to the company’s communication with the customer:
- The use of benefit-focused messaging that emphasizes the daily value of using the product, both functionally and in terms of experience.
- Tips on how to use the product.
- The availability of quick and effective customer support, strengthening trust and satisfaction.
Furthermore, the team identifies drivers and barriers related to the product design:
- An acceptable level of physical and cognitive effort to operate the product.
- The compatibility of the product with users’ daily routines/devices.
- The extent to which displays are understandable and readable by a diversity of users.
By selecting and combining these drivers and barriers the team identifies four potential critical success factors for daily product use that can be influenced by marketing or re-design of the product. For each of them the hypotheses are formulated:
A high level of customer perceived usefulness (\(X_1\)) of the product is necessary for daily use of the product (\(Y\));
A high compatibility (\(X_2\)) of the product is necessary for daily use of the product (\(Y\)).
A high level of customer perceived ease of use (\(X_3\)) of the product is necessary for daily use of the product (\(Y\));
A high emotional value (\(X_4\)) of the product is necessary for daily use of the product (\(Y\));
12.7.2 Example Part 2: Intervention design
In part 2, the intervention is designed. First, data are collected for the four expected necessary conditions (\(X\)) and the frequency of product use (\(Y\)). The data are analyzed with NCA. The results indicate that the four conditions are necessary (see Appendix H.5). This means that the selected four conditions are relevant to be acted upon during the intervention. The \(XY\)-plots are displayed in Figure 12.6.
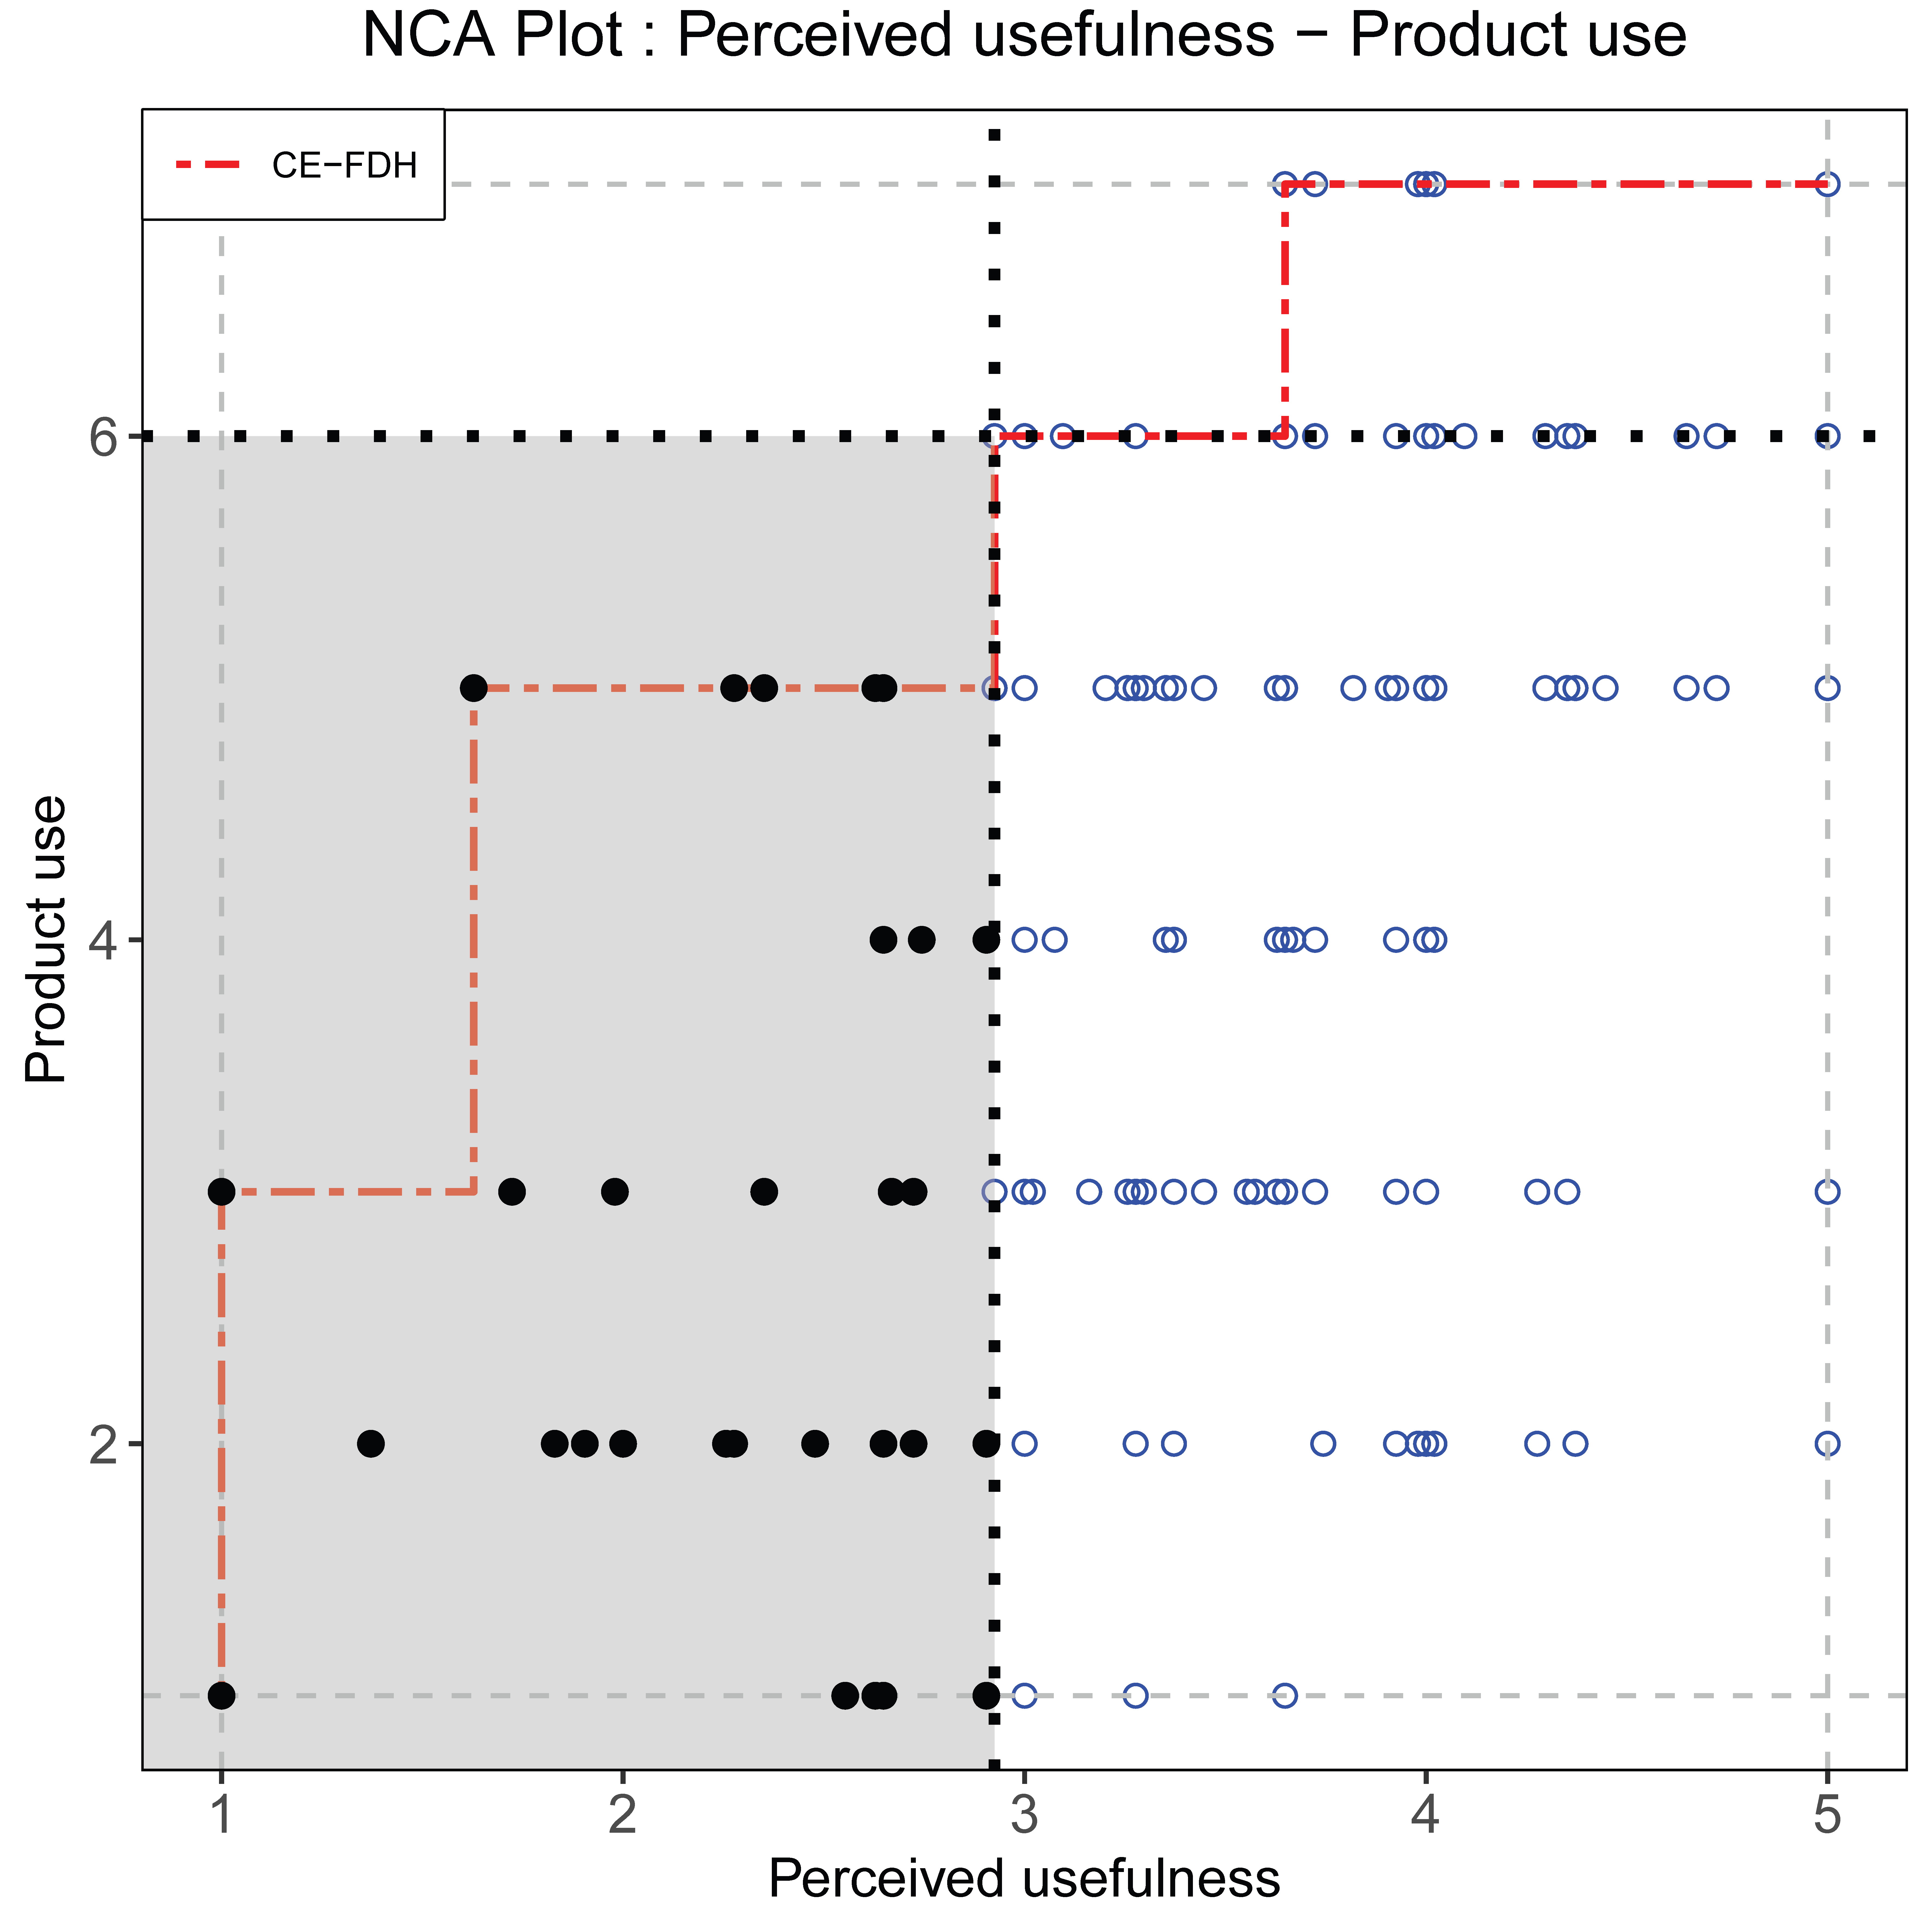
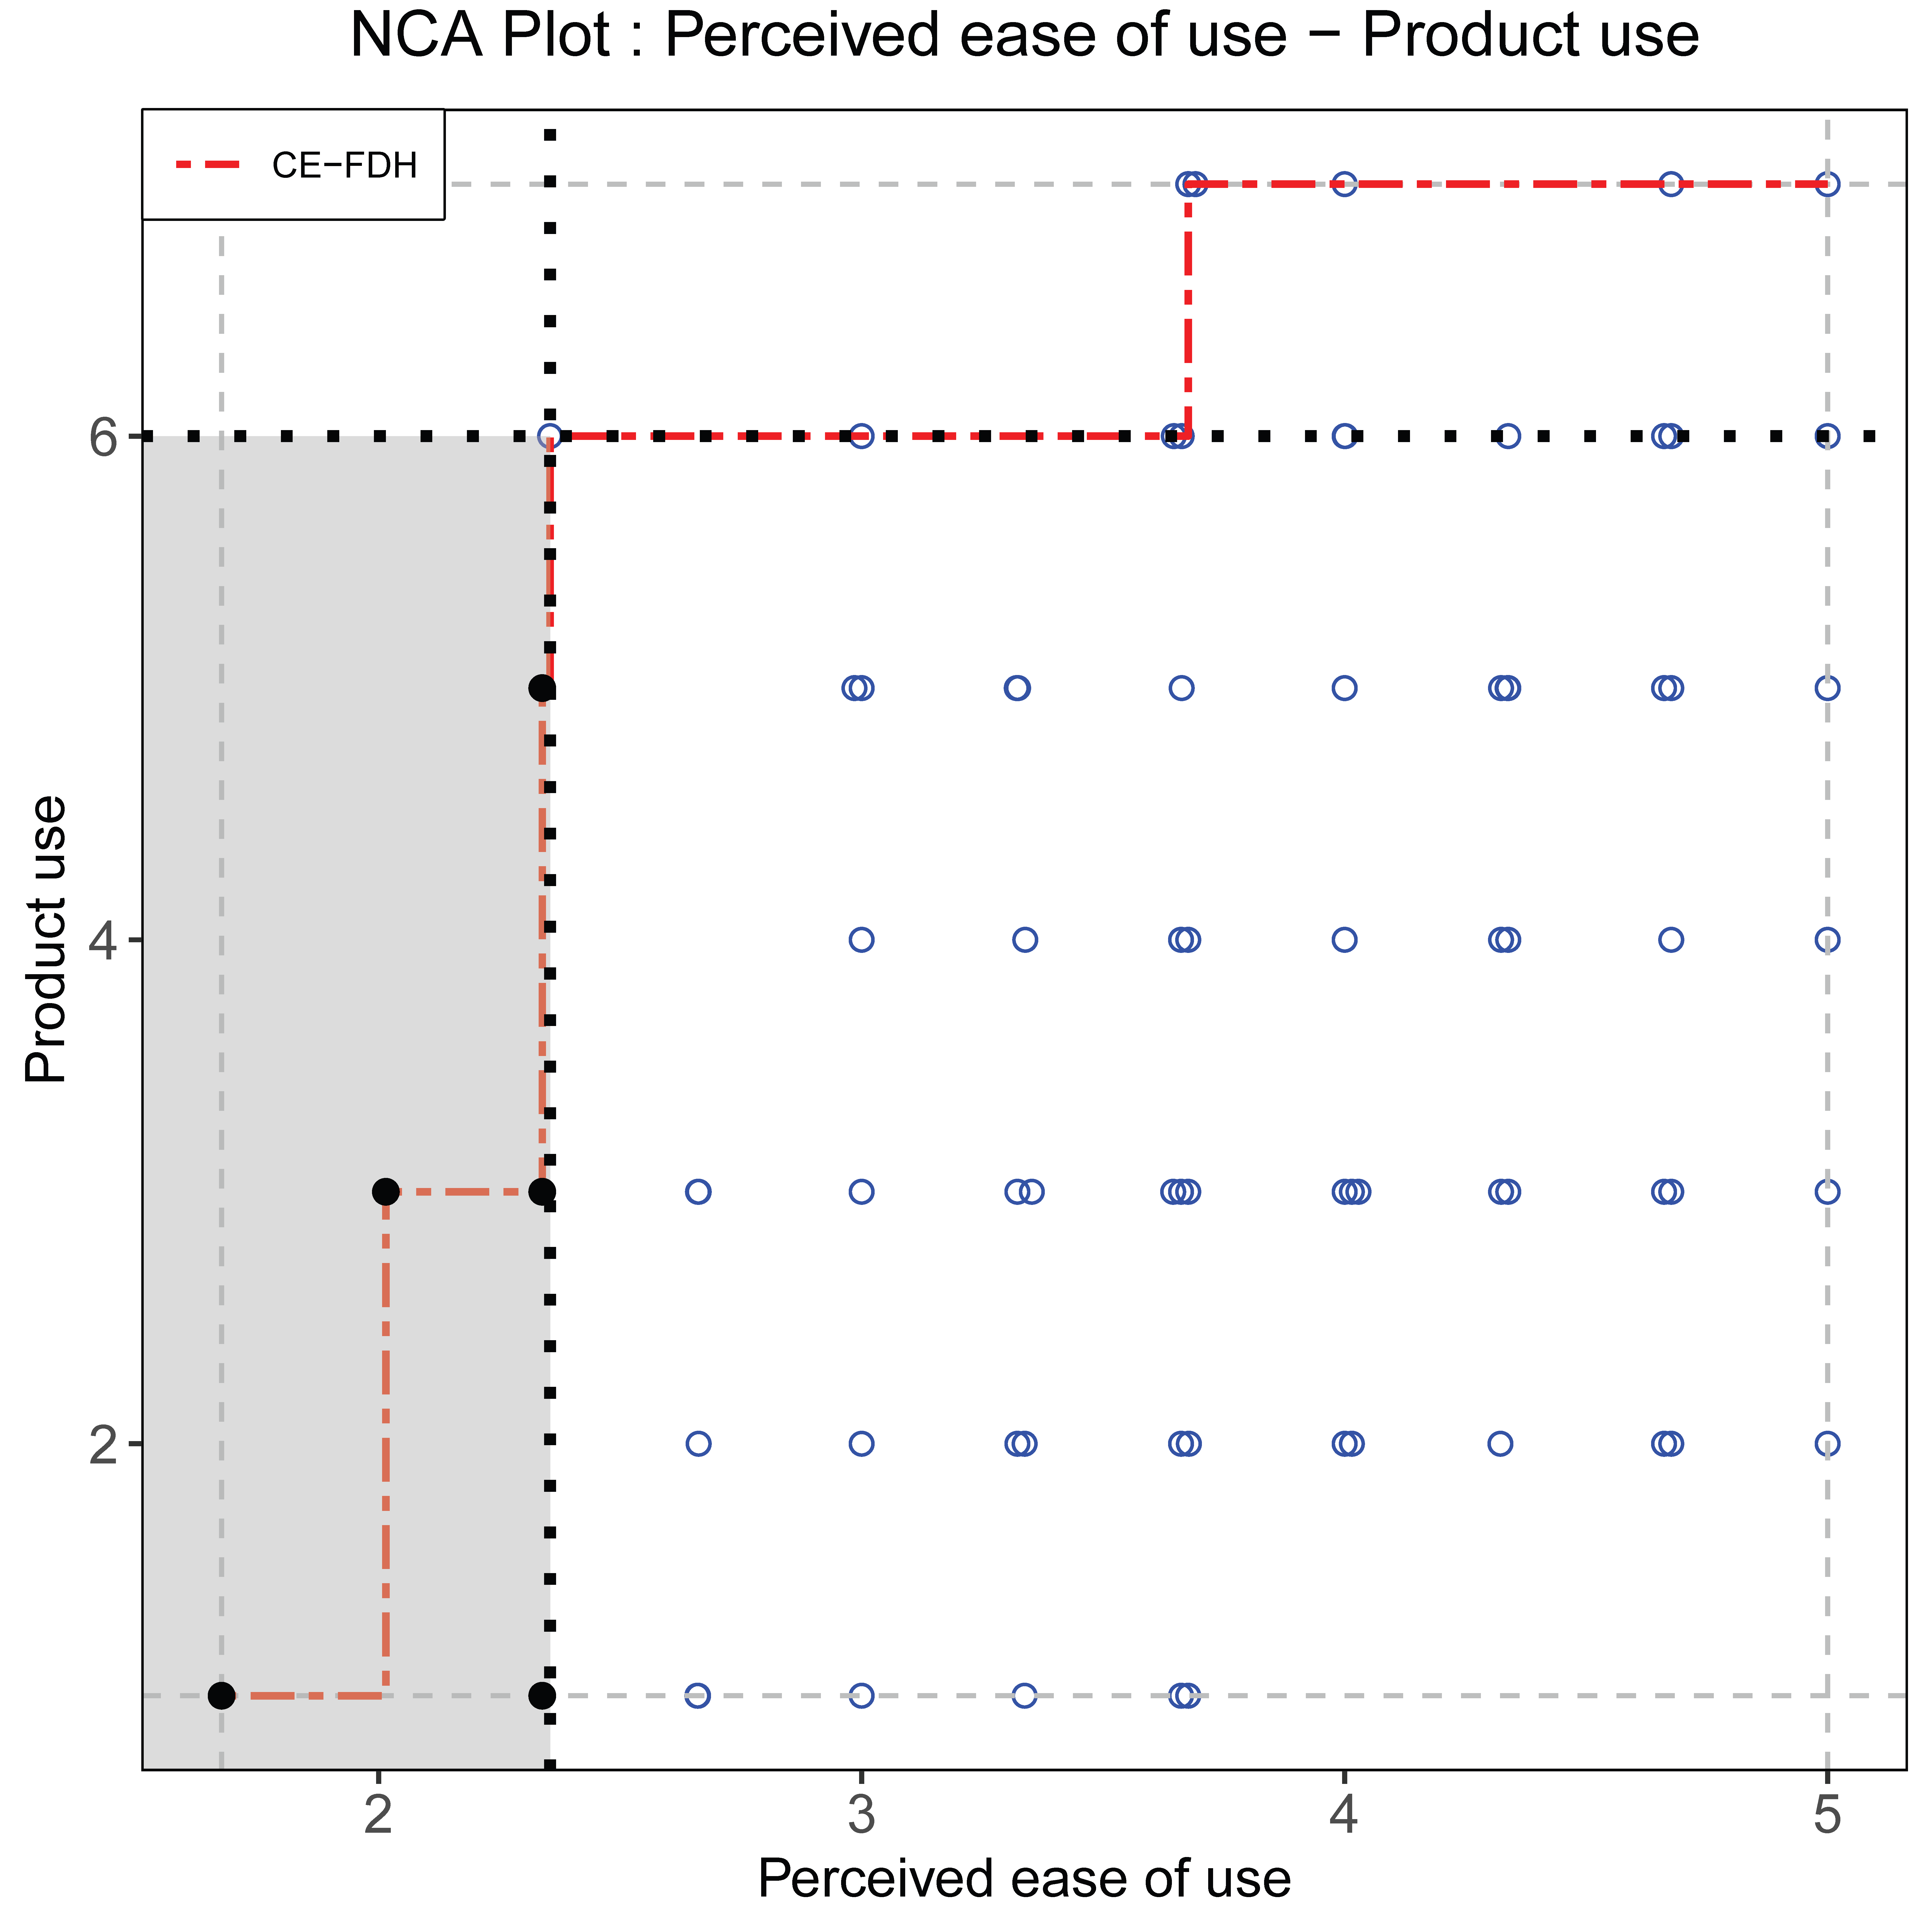
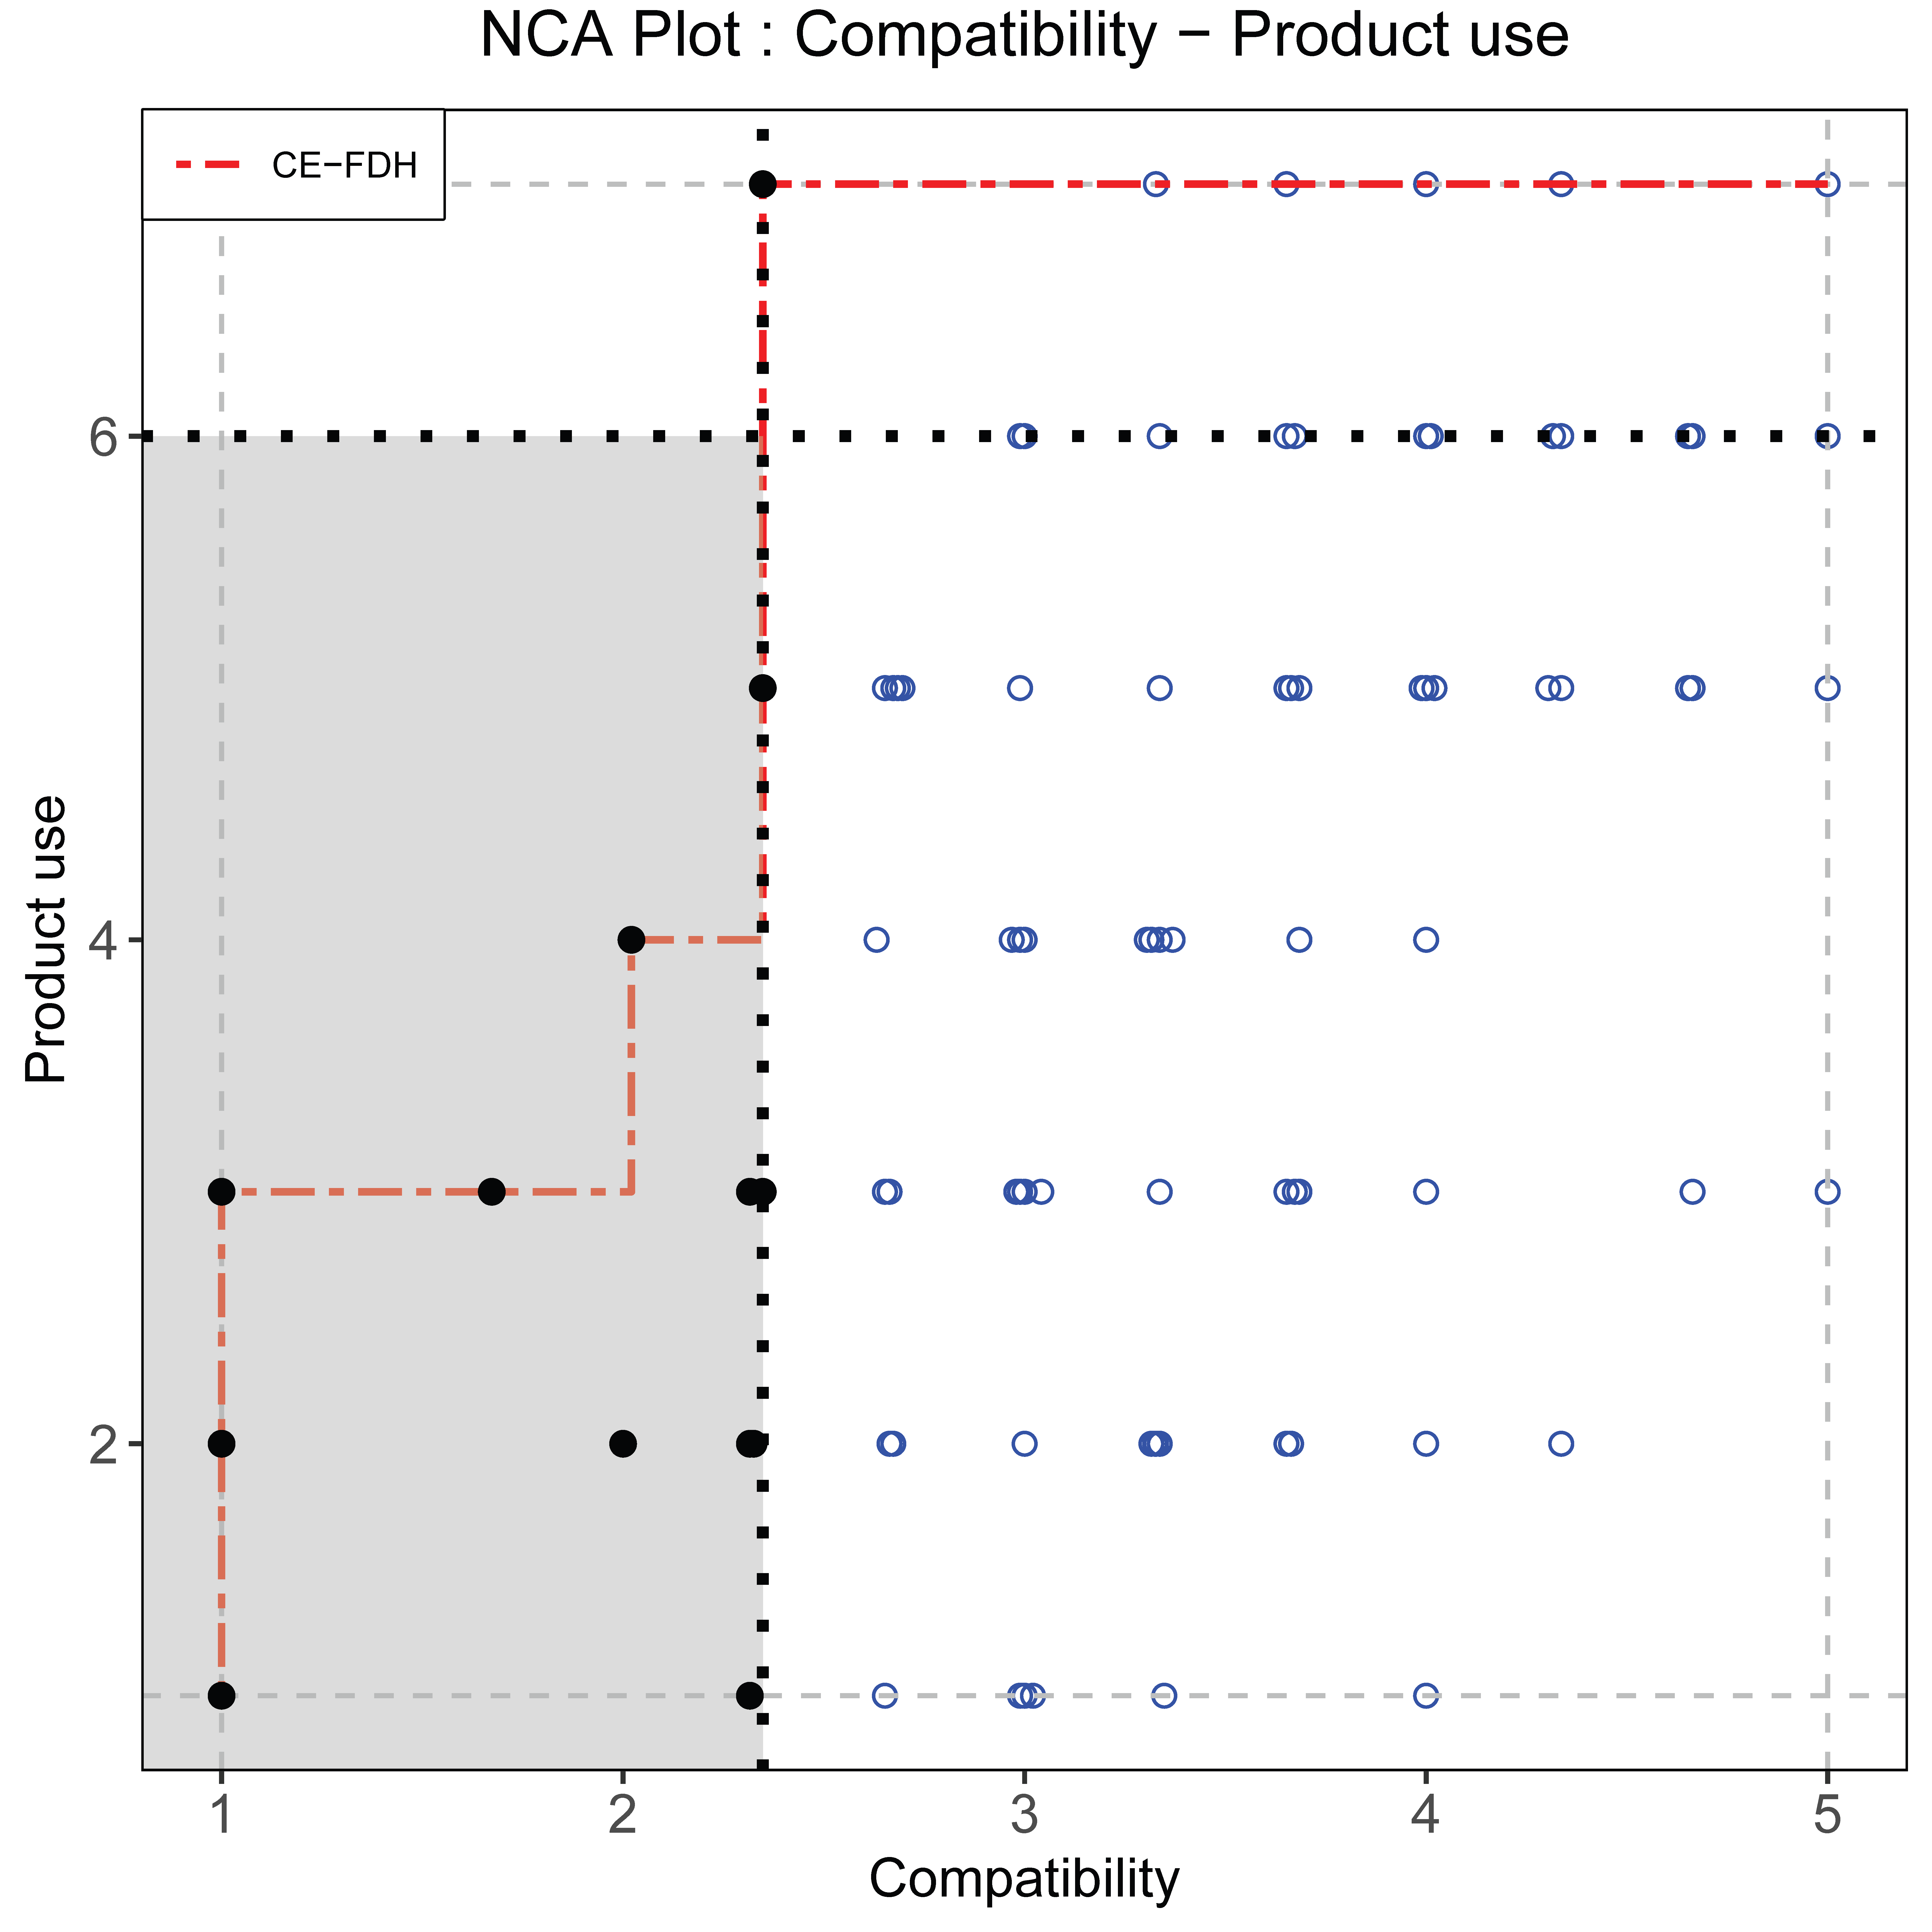
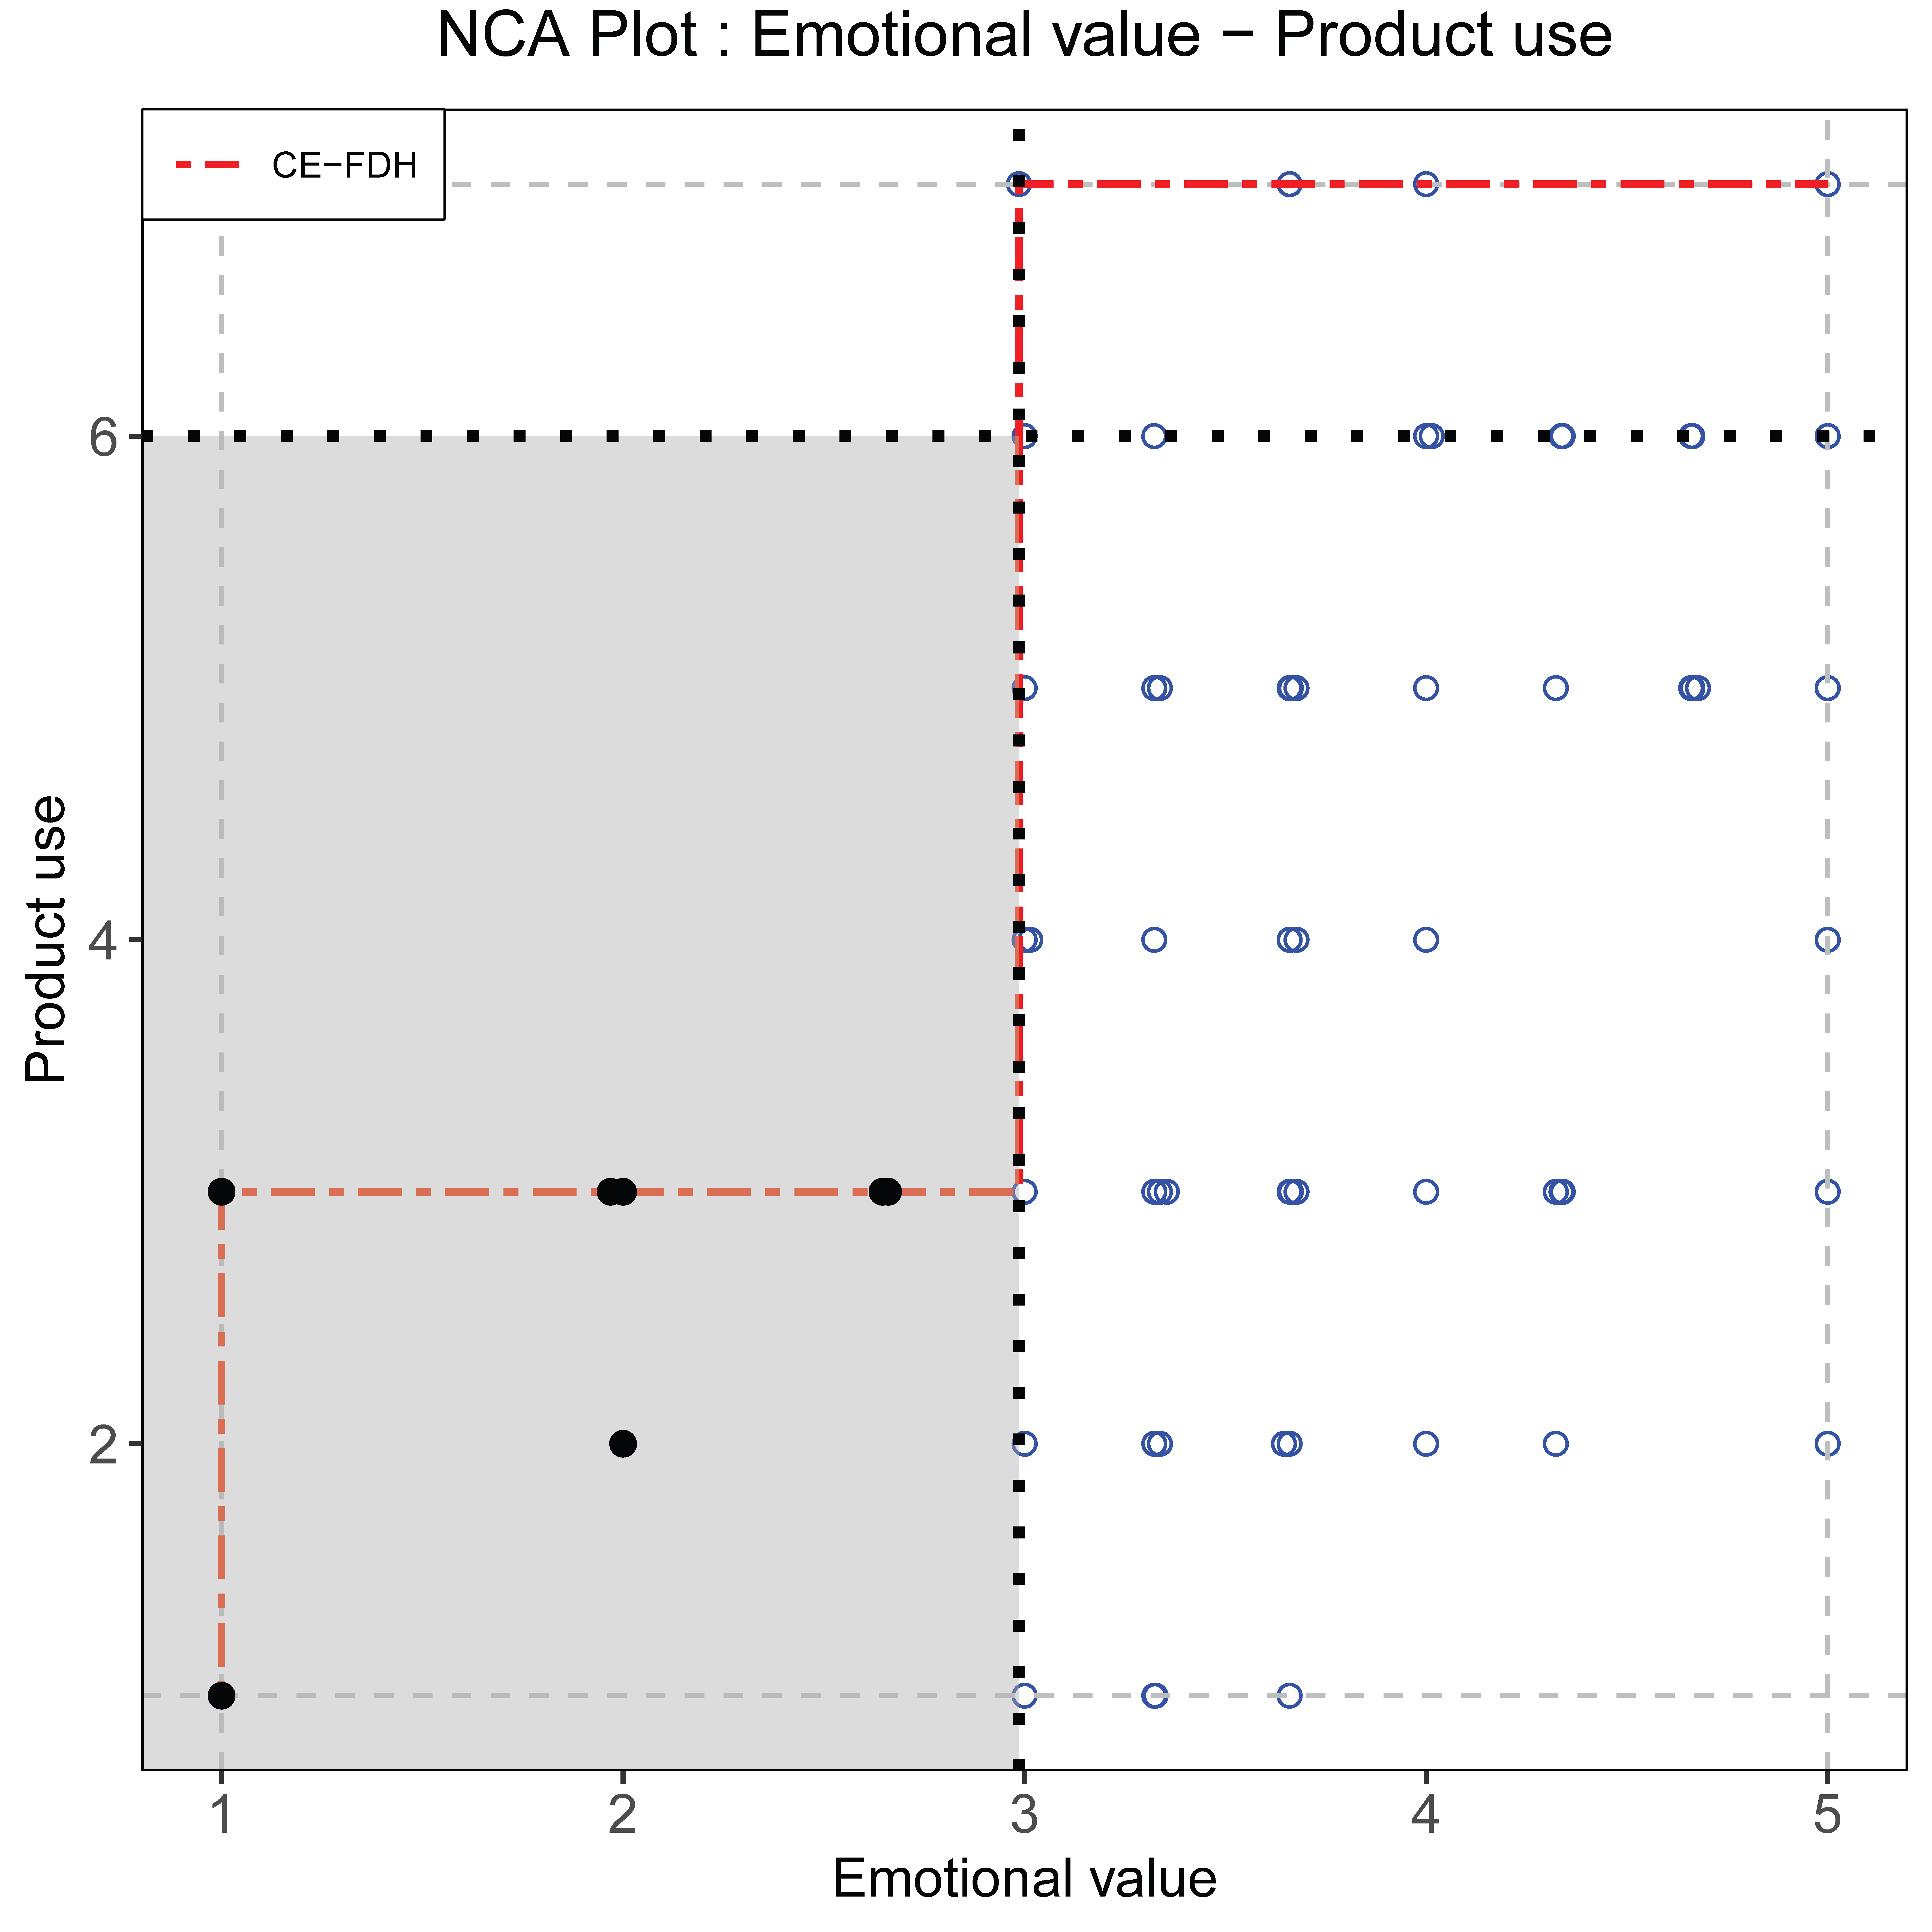
Figure 12.6: Example: bottleneck areas (gray) for the four necessary conditions.
Each plot has 174 dots (customers). The stepwise linear ceiling line separates the empty impossible area from the possible area with cases. The horizontal dotted line in each plot at product use level 6 corresponds to daily product use. This is the desired target outcome \(y_c\). The vertical dotted line is the corresponding threshold value of the condition (\(x_c\)). The black dots in each plot are cases in the bottleneck area: the area to the left of the threshold condition and below the ceiling line. Black dots are customers that have not achieved the level of the condition that is necessary for the desired target outcome. These customers will not use the product daily because Perceived usefulness is too low (30 = 17% of the customers), Compatibility is too low (19 = 11%), Perceived ease of use is too low (5 = 3%), and/or Emotional value is too low (10 = 6%).
The number and percentage of cases between brackets are obtained from the bottleneck distances table of Table I.1 in Appendix I. This table shows all 38 bottleneck cases (22%), their distances to the threshold conditions, the number of conditions where they are constrained, and their total bottleneck distance to be overcome by the intervention. This means that 22% of the customers have too low values of one or more conditions. The other 78% are able to achieve the target outcome from the perspective of their values of the four necessary conditions. They may or may not have achieved the target outcome as this depends on other factors that are not measured (the necessary condition is not sufficient). The company’s intervention should focus only on the 22% cases that are in the bottleneck area. Acting on other cases that already meet the threshold condition is ineffective in an NCA-based intervention. These cases already have the possibility to achieve the outcome. If the company acts only on bottleneck cases, the intervention effort should correspond to the bottleneck distance to avoid ineffectiveness and inefficiency. For 100% effectiveness and 100% efficiency, all cases’ bottlenecks must be handled that way.
The example illustrates how NCA can identify multiple necessary conditions for a practical goal (daily product use) and determine their threshold levels; how bottleneck areas and bottleneck cases (22% of customers) can be made visible for each necessary condition; how an intervention can be focused only on those customers in the bottleneck area, rather than on the entire target group; how this selective, threshold-based focus supports more effective and efficient interventions than approaches guided by average effects alone.