E Simulations for TPR and TNR
This appendix provides additional simulation results for the True Positive Rate (TPR; sensitivity) and the True Negative Rate (TNR; specificity), as discussed in Section 6.3.
E.1 True Positive Rate (TPR)
With the same simulation settings as in Figure 6.3, Figure E.1 shows the simulation results for an effect size \(d = 0.20\) instead of \(d = 0.10\). All TPR curves shift to the left. Consequently, with a larger true effect size, the required sample size is smaller to achieve the same TPR.
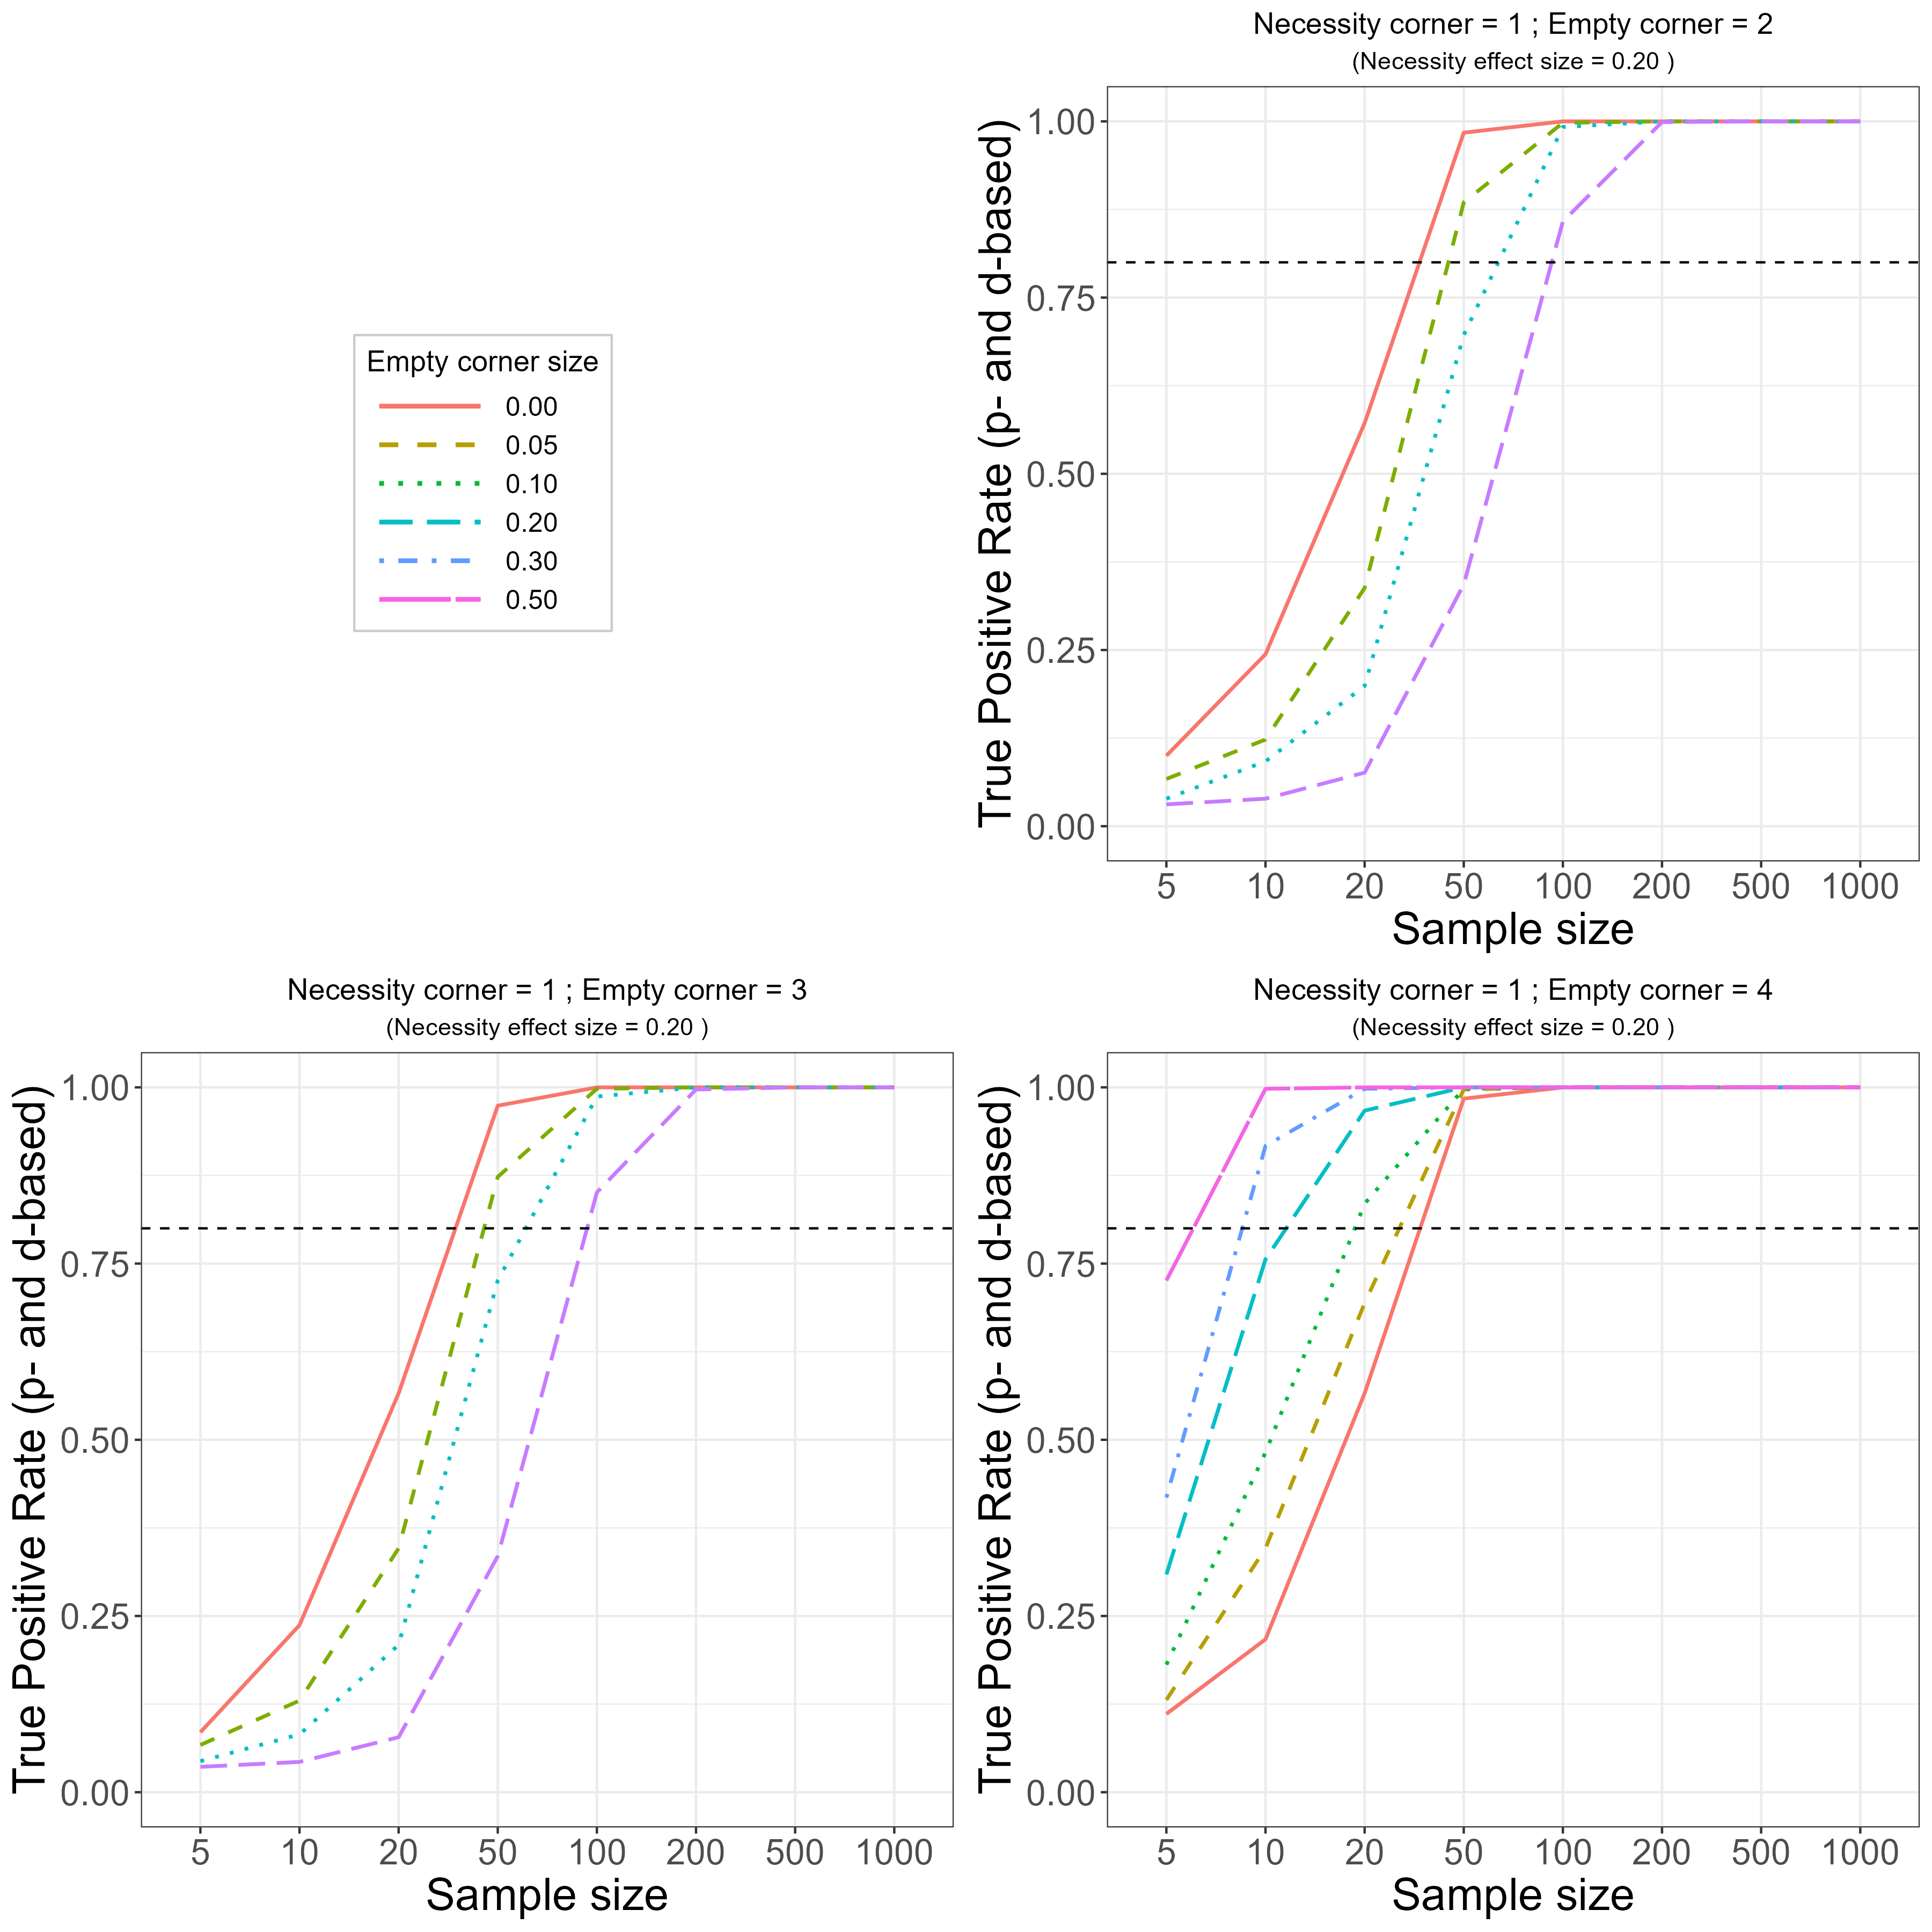
Figure E.1: True Positive Rate (TPR, sensitivity) of the NCA approach for identifying necessity in the population. True necessity effect size in corner 1 = 0.20. Slopes of ceiling/floor lines are 1 (corners 1 and 4) or \(-1\) (corners 2 and 3). Top-Right: other empty corner = 2. Bottom-Left: other empty corner = 3. Bottom-Right: other empty corner = 4.
With the same simulation settings as in Figure 6.3, Figures E.2 and E.3 show the simulation results for ceiling slopes of 0.60 and 1.67, respectively, instead of 1. This comparison allows evaluation of the (non)-evenness of the TPR curves for scenarios B and C as a function of the slope of the ceiling line. Only the slope of the ceiling line in the necessity corner of interest is changed. Because the slopes of the lines in the other empty corners remain the same (-1), this slope change introduces asymmetry. Due to the intersection of the lines within the bounding box (Figure 6.2), only an effect size of 0.12 could be evaluated. The results indicate that the slope change has little or no effect on the TPR curves.
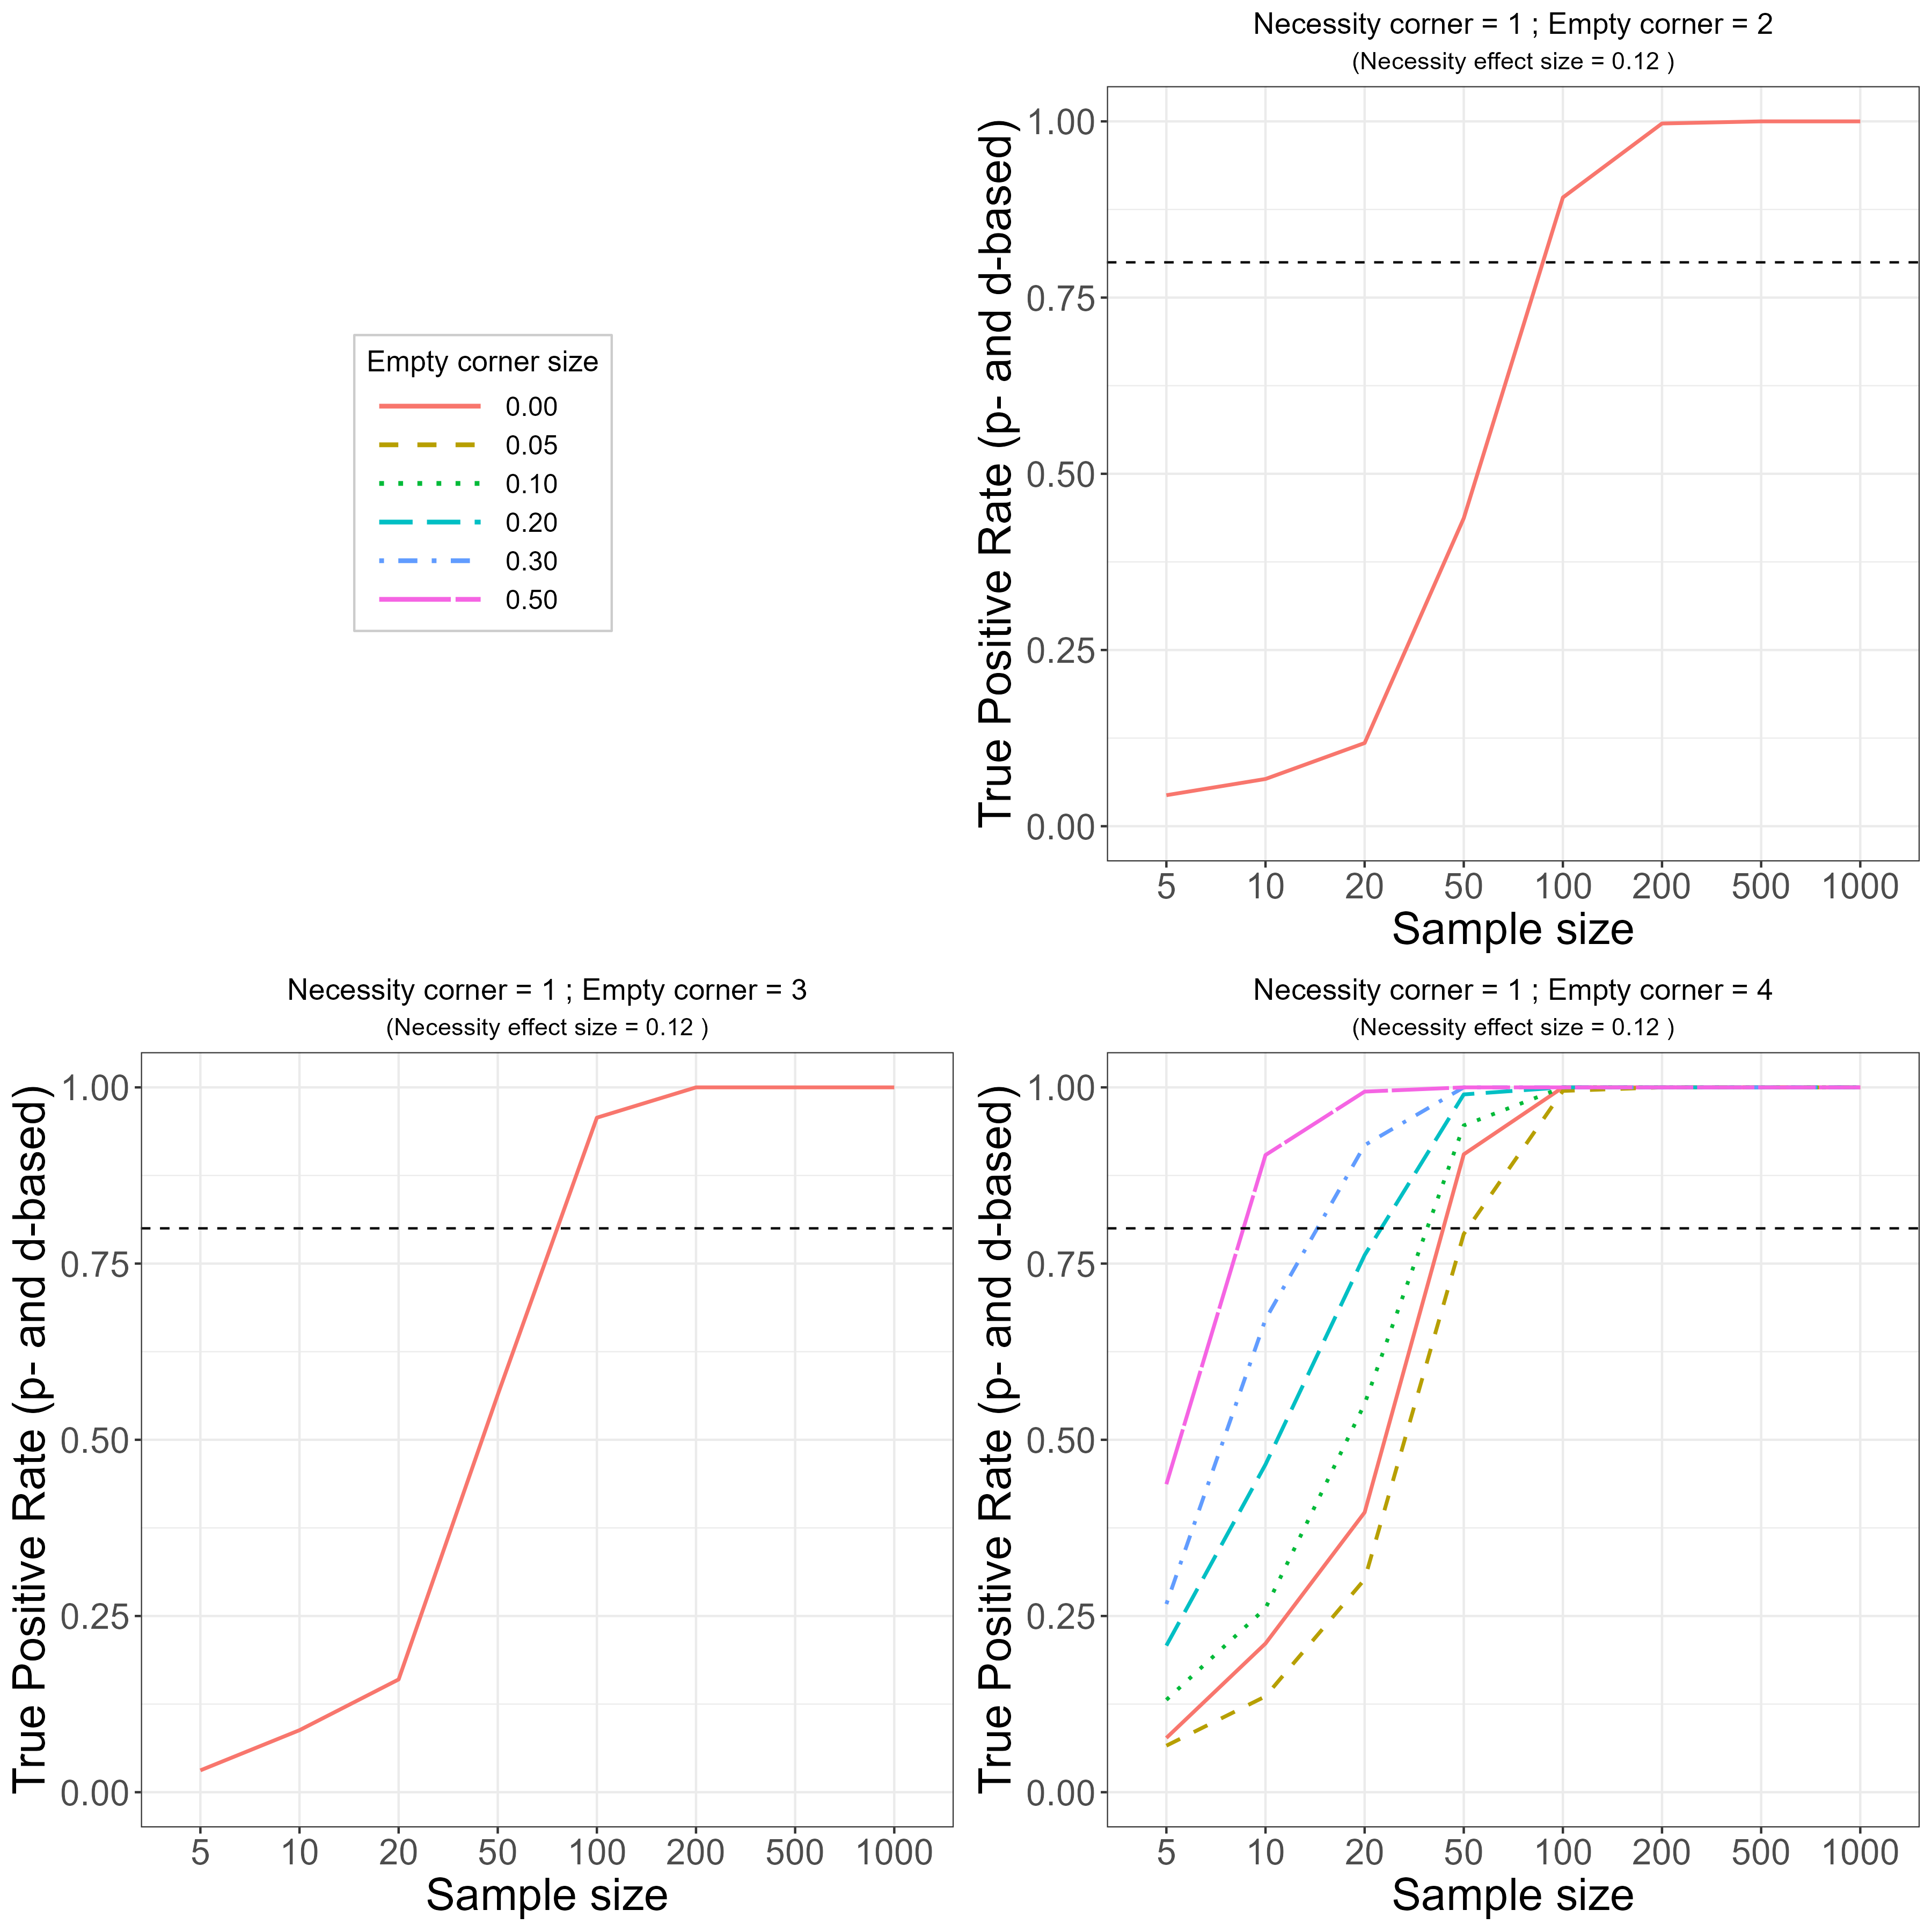
Figure E.2: True Positive Rate (TPR, sensitivity) of the NCA approach for identifying necessity in the population. True necessity effect size in corner 1 = 0.12. Slope of necessity ceiling line (corner 1) = 0.60. Slopes of ceiling/floor lines of other empty corners are 1 (4) or \(-1\) (corners 2 and 3). Top-Right: other empty corner = 2. Bottom-Left: other empty corner = 3. Bottom-Right: other empty corner = 4.
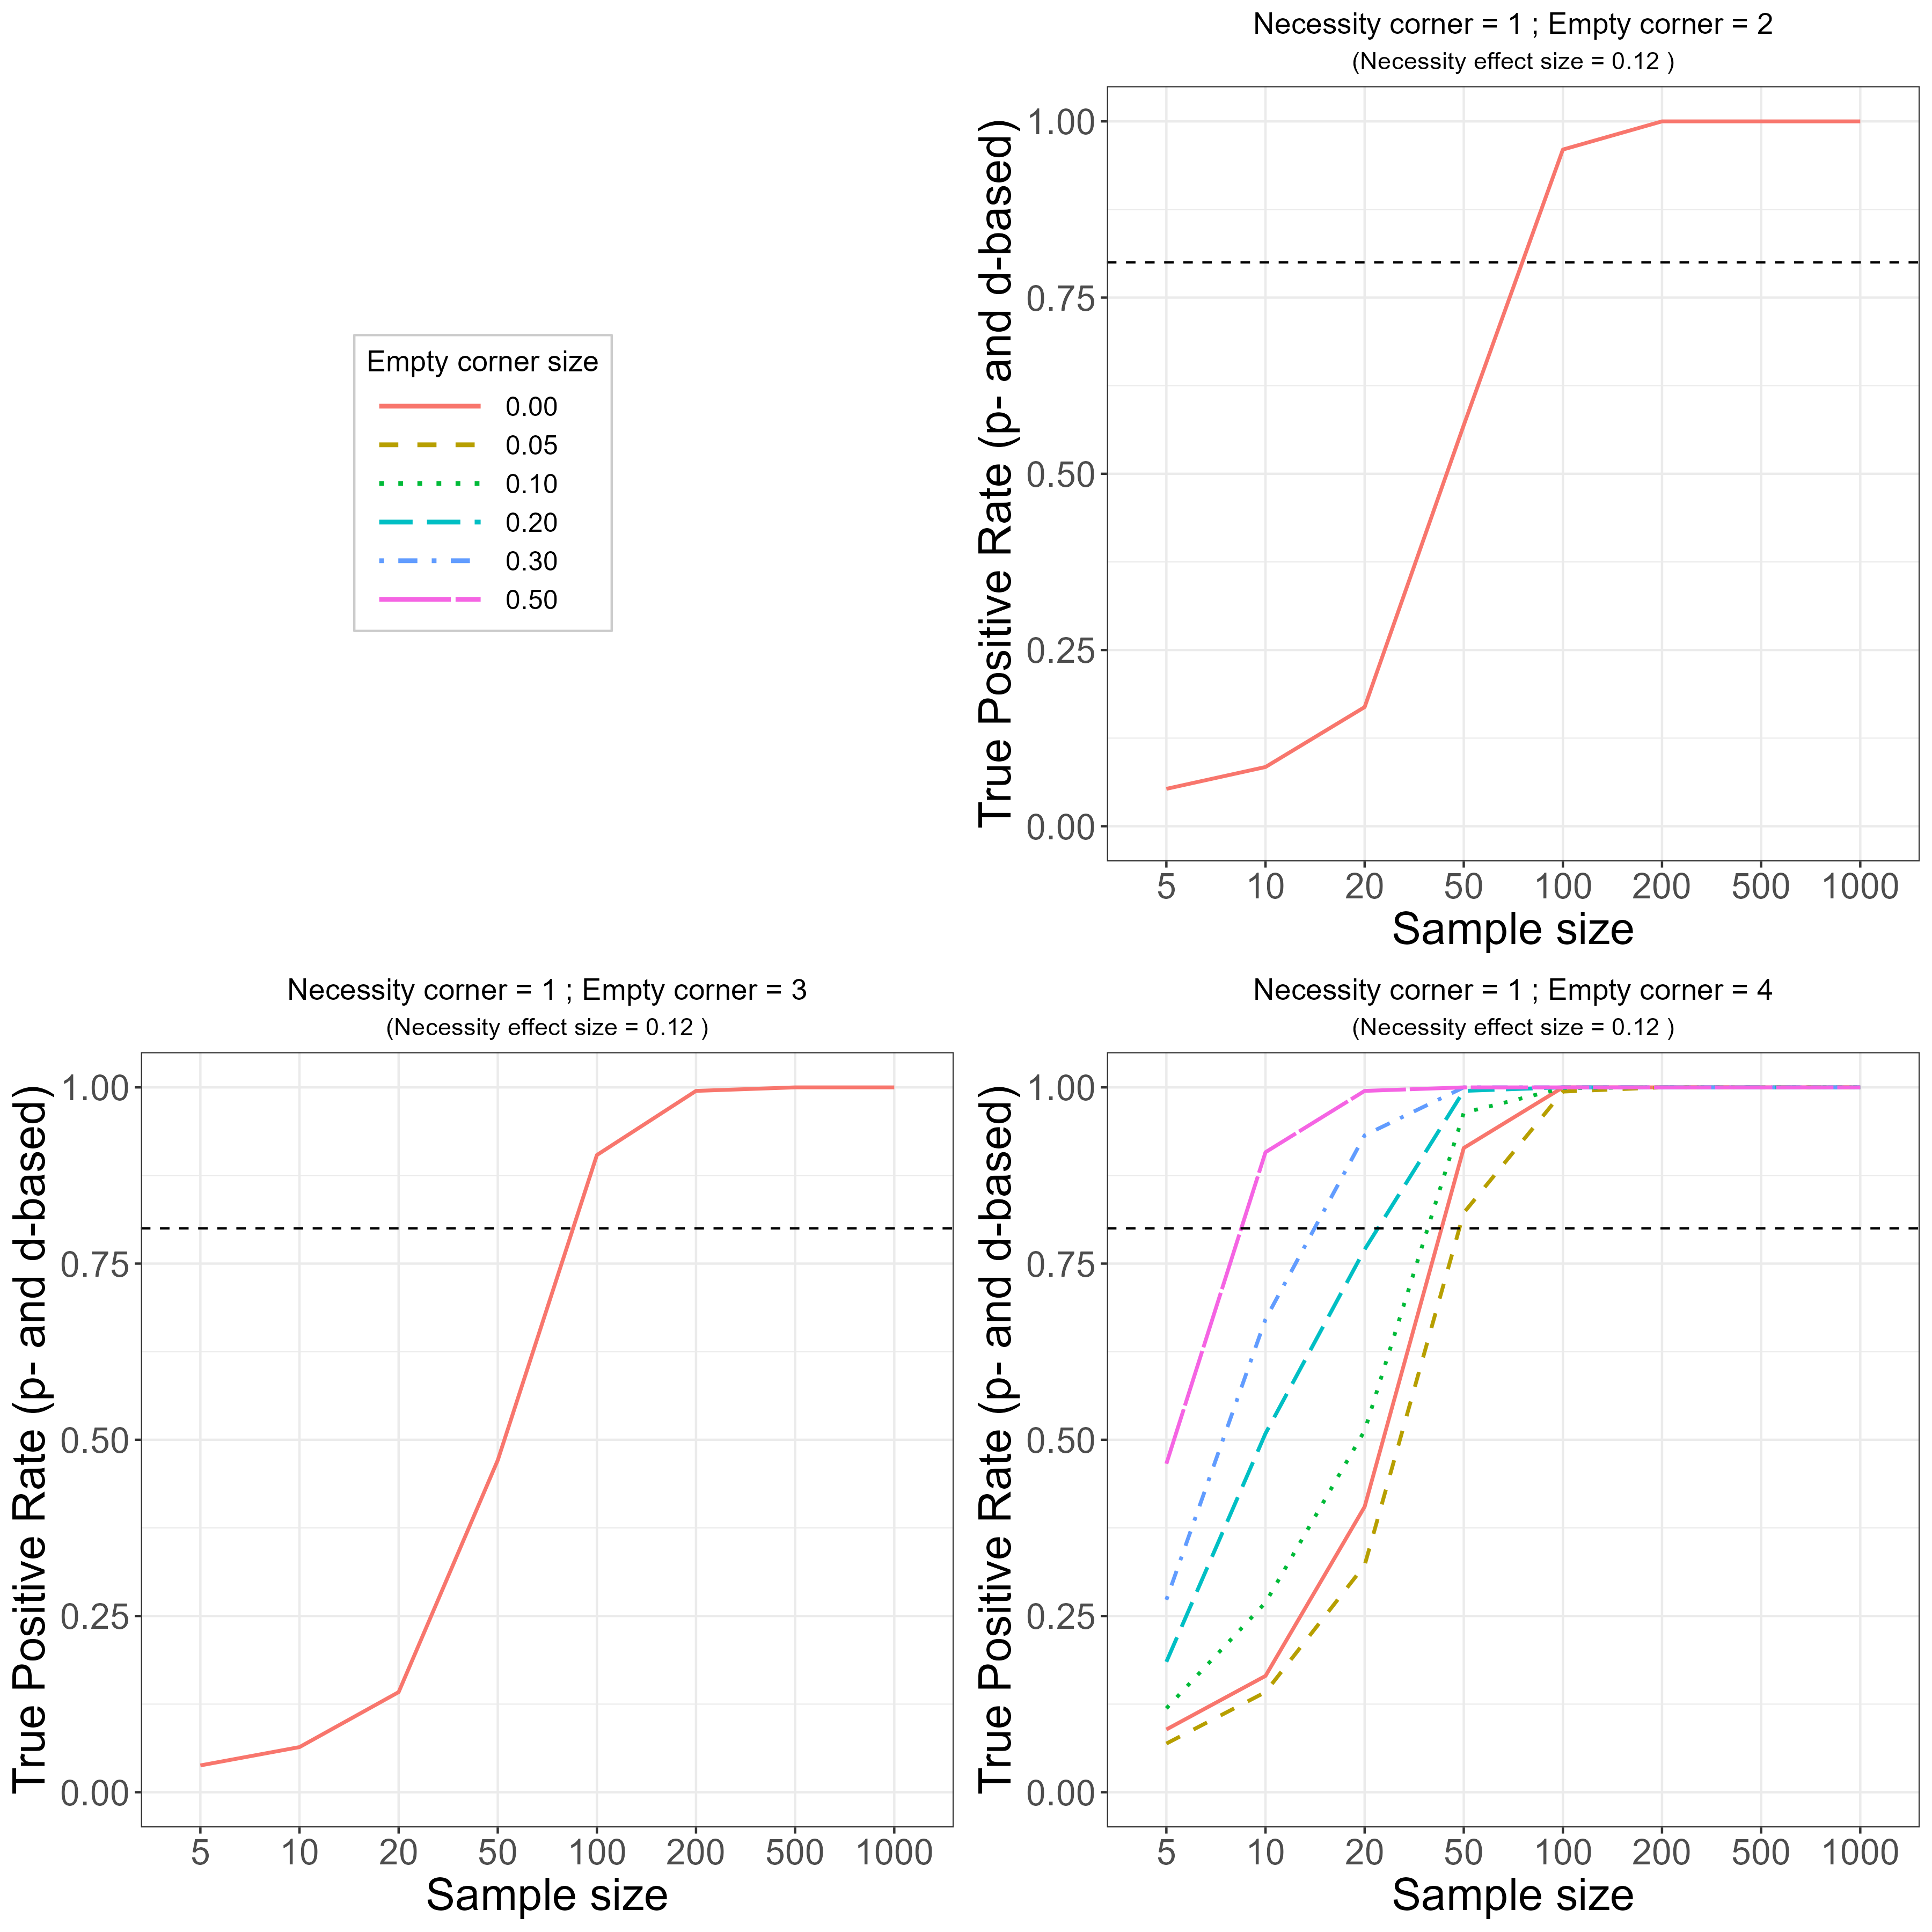
Figure E.3: True Positive Rate (TPR, sensitivity) of the NCA approach for identifying necessity in the population. True necessity effect size in corner 1 = 0.12. Slope of necessity ceiling line (corner 1) = 1.67. Slopes of ceiling/floor lines of other empty corners are 1 (4) or \(-1\) (corners 2 and 3). Top-Right: other empty corner = 2. Bottom-Left: other empty corner = 3. Bottom-Right: other empty corner = 4.
The results show that the evenness of the curves for scenarios B and C remains. This may not be the case if the sizes of empty corners 2 and 3 differ, or if the \(X\) and \(Y\) distributions in the feasible area differ.
E.2 True Negative Rate (TNR)
With the same simulation settings as in Figure 6.4, Figure E.4 shows TNR (\(p\)- and \(d\)-based) when the distribution in the feasible space is based on a normal distribution instead of a uniform distribution.
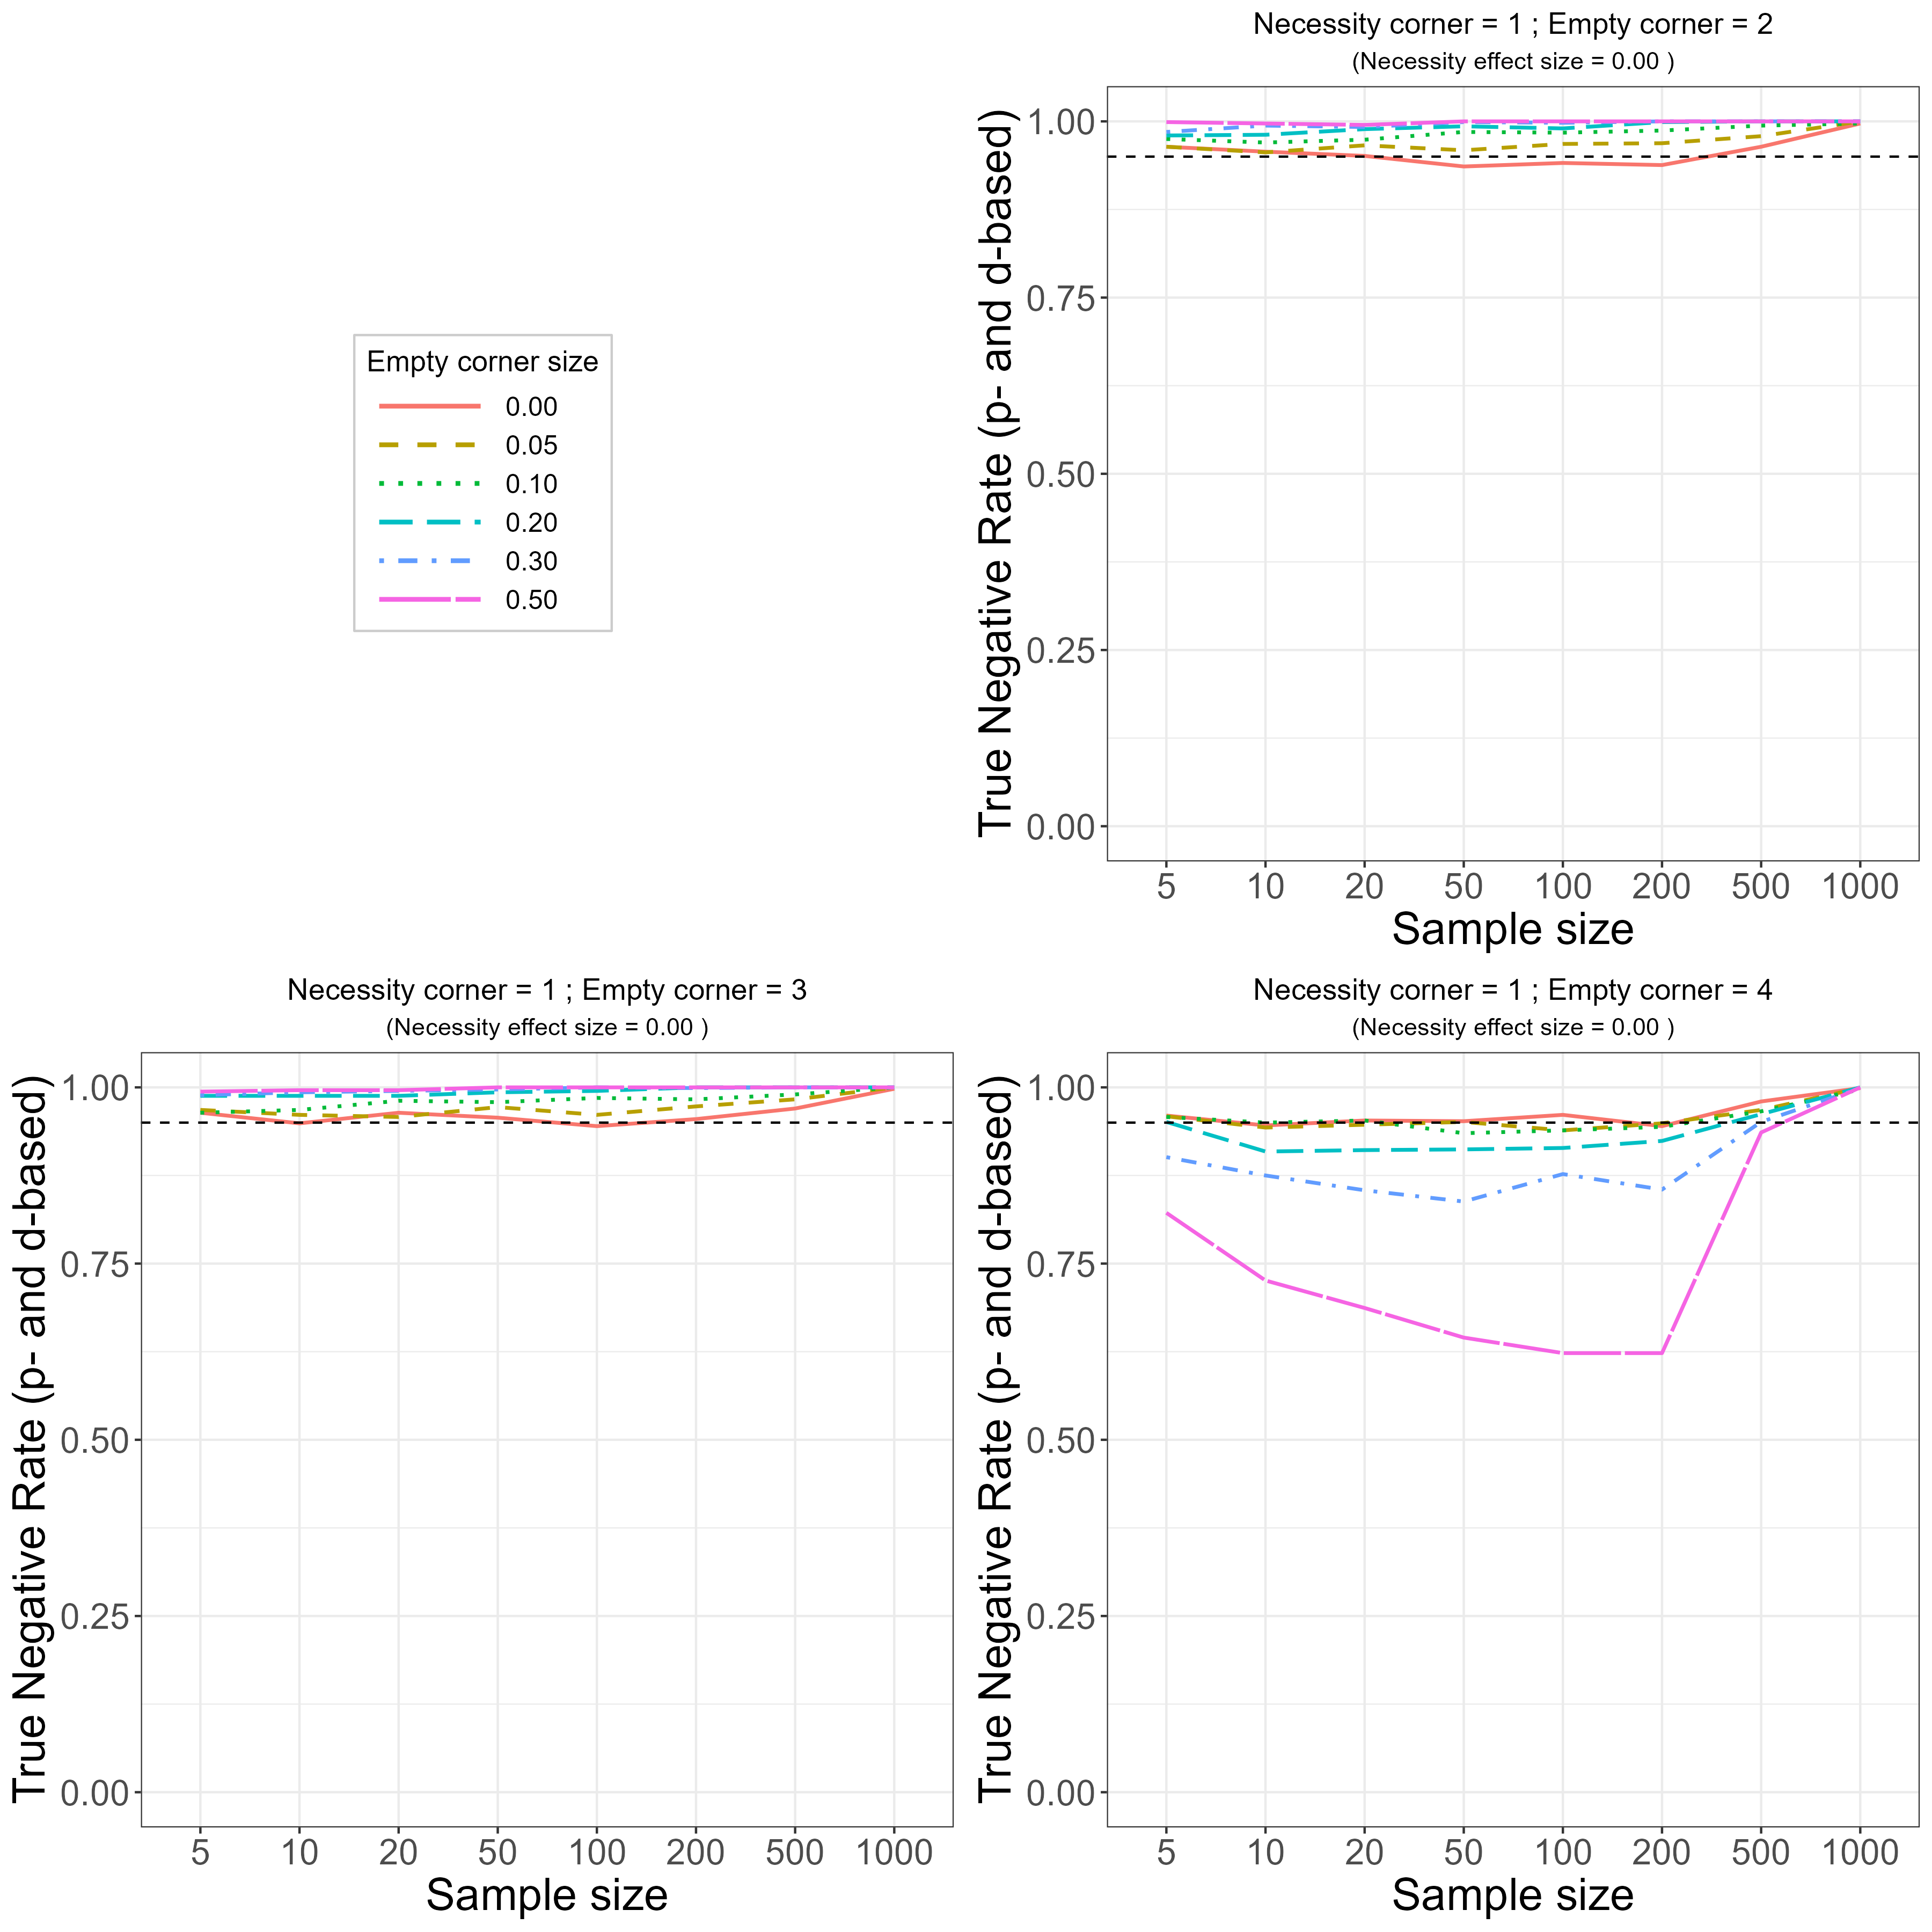
Figure E.4: True Negative Rate (TNR, specificity) of the NCA approach for identifying necessity in the population with the \(p\) and \(d\)-value criterion, with normal distribution of cases in the feasible space. True necessity effect size in corner 1 = 0 for different sizes of other empty corners. Top-Right: other empty corner = 2. Bottom-Left: other empty corner = 3. Bottom-Right: other empty corner = 4.
The high TNR for empty corners 2 and 3 remains, whereas the curves for corner 4 shift to the right. This means that with a normal-based distribution under the ceiling, a larger sample size is required compared to a uniform distribution to obtain the same TNR.